 Indietro
Introductory Statistics: Displaying and Describing Data (Chapter 2 Study Guide)
Guida di studio - Note intelligenti
 Appunti personalizzati basati sui tuoi materiali, ampliati con definizioni chiave, esempi e contesto.
Q1. Fill out the following table: Data Type and Appropriate Graphical Display
Background
Topic: Types of Data and Graphical Displays
This question tests your understanding of the distinction between categorical and quantitative data, and which graphical displays are appropriate for each type.
Key Terms:
Categorical Data: Data that can be grouped into categories (e.g., colors, blood types).
Quantitative Data: Data that can be measured numerically (e.g., height, age).
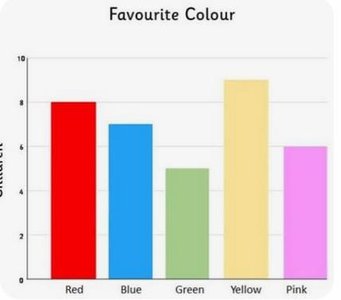
Bar Chart: Used for displaying categorical data.
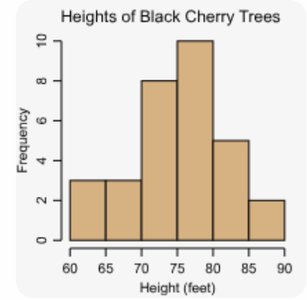
Histogram: Used for displaying quantitative data.
Step-by-Step Guidance
Identify whether the data type is categorical or quantitative.
Recall that bar charts are used for categorical data, while histograms are used for quantitative data.
Match each data type to its appropriate graphical display.
Review examples of each type of graph to reinforce your understanding.
Try solving on your own before revealing the answer!
Final Answer:
Categorical Data: Bar chart
Quantitative Data: Histogram
Bar charts are best for categorical variables because they show counts or frequencies for each category. Histograms are best for quantitative variables because they show the distribution of numerical values.
Q2. Of the following data sets, which would you display with a bar chart, and which would you display with a histogram? Briefly explain your choices.
Background
Topic: Choosing Appropriate Graphical Displays
This question tests your ability to distinguish between categorical and quantitative variables and select the correct graphical display for each.
Key Terms:
Bar Chart: Used for categorical variables.
Histogram: Used for quantitative variables.
Step-by-Step Guidance
For each data set, determine if the variable is categorical or quantitative.
Recall that categorical variables (like gender or blood type) are best displayed with bar charts.
Quantitative variables (like age or height) are best displayed with histograms.
Explain your reasoning for each choice based on the variable type.
Try solving on your own before revealing the answer!
Final Answer:
(a) Gender: Bar chart (categorical)
(b) Age: Histogram (quantitative)
(c) Height: Histogram (quantitative)
(d) Blood type: Bar chart (categorical)
Bar charts are used for categorical variables, while histograms are used for quantitative variables.
Q3. Definitions: Frequency and Relative Frequency for Categorical Data
Background
Topic: Frequency Distributions for Categorical Data
This section introduces the concepts of frequency and relative frequency for categorical variables.
Key Terms and Formulas:
Frequency: The number of times a category appears in the data set.
Relative Frequency: The proportion of observations in a category, calculated as:

Step-by-Step Guidance
Identify the frequency for each category in the data set.
Calculate the total number of observations by summing all frequencies.
Use the formula above to compute the relative frequency for each category.
Round your answers to four decimal places as instructed.
Try solving on your own before revealing the answer!
Final Answer:
American:
Japanese:
Korean:
German:
Other:
Relative frequencies show the proportion of each category in the data set.
Q4. Construct a bar chart for these data using relative frequency. Then comment on the bar chart using the context of the study.
Background
Topic: Bar Charts for Categorical Data
This question tests your ability to construct and interpret a bar chart for categorical data using relative frequencies.
Key Terms:
Bar Chart: A graphical display for categorical data, showing frequencies or relative frequencies for each category.
Relative Frequency: Proportion of each category in the data set.
Step-by-Step Guidance
Use the relative frequencies calculated in the previous question.
Draw a bar chart with categories on the x-axis and relative frequencies on the y-axis.
Interpret the chart: Which category is most common? Which is least common?
Consider what the chart tells you about previous car ownership in the context of the study.
Try solving on your own before revealing the answer!
Final Answer:
The bar chart shows that "American" is the most common previous car ownership, followed by "Japanese." "Other" is the least common. This suggests that most people who bought an American car previously owned another American car.
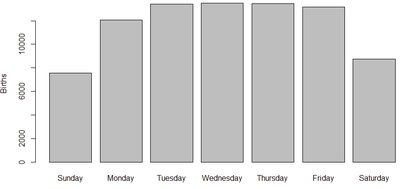
Q5. Here is the number of babies born on each day of the week in 2006 for a particular city in USA.
Background
Topic: Describing Categorical Data with Bar Charts
This question asks you to describe the variable and interpret a bar chart showing the number of births by day of the week.
Key Terms:
Variable: The characteristic being measured (day of the week for births).
Bar Chart: Used to display counts for each category.
Step-by-Step Guidance
Identify the variable: day of the week (categorical) and number of births (quantitative).
Examine the bar chart to see which days have the highest and lowest number of births.
Consider possible reasons for the observed pattern (e.g., hospital scheduling, cultural factors).
Summarize your interpretation based on the chart.
Try solving on your own before revealing the answer!
Final Answer:
The variable is the day of the week (categorical), and the chart shows that births are less frequent on weekends, especially Sunday, and most frequent on weekdays. This pattern may reflect hospital scheduling practices.
