 Indietro
Introductory Statistics: Foundations, Data, and Descriptive Analysis
Guida di studio - Note intelligenti
 Appunti personalizzati basati sui tuoi materiali, ampliati con definizioni chiave, esempi e contesto.
Introduction to Statistics
What is Statistics?
Statistics is the science of learning from data. It involves collecting, analyzing, interpreting, and presenting data to support decision-making and scientific discovery. The field provides a framework for making inferences about populations based on samples, and for quantifying uncertainty in those inferences.
Descriptive Statistics: Summarizes and describes the features of a dataset (e.g., mean, median, mode, standard deviation).
Inferential Statistics: Uses data from a sample to make generalizations or predictions about a population.
Key Terms and Concepts
Data: Collected observations or measurements, which can be numerical or categorical.
Individuals (Cases): The objects described by a set of data (e.g., people, animals, plants, or things).
Population: The entire group of individuals or cases of interest.
Sample: A subset of the population, selected for analysis.
Variable: Any characteristic or attribute that can vary among individuals in a population (e.g., age, height, gender).
Populations, Samples, and Study Design
Populations and Samples
Understanding the distinction between populations and samples is fundamental in statistics:
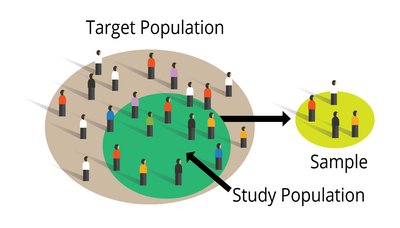
Target Population: The entire group about which researchers want to draw conclusions.
Study Population: The group from which the sample is actually drawn; often a subset of the target population.
Sample: The actual individuals selected for study.
Types of Populations
Finite Population: A countable, well-defined group (e.g., all students in a school).
Infinite Population: An uncountable or extremely large group (e.g., all possible future customers).
Sources of Error
Study Error: Occurs if the study population is not representative of the target population.
Sample Error: Occurs if the sample is not representative of the study population.
Types of Variables
Quantitative vs. Qualitative Variables
Quantitative (Numeric) Variables: Take numerical values; arithmetic operations make sense (e.g., height, age).
Discrete Variables: Can only take specific, separate values (e.g., number of children).
Continuous Variables: Can take any value within a range (e.g., weight, temperature).
Qualitative (Categorical) Variables: Take on categories or labels (e.g., gender, blood type).
Nominal Variables: Categories with no logical order (e.g., eye color).
Ordinal Variables: Categories with a meaningful order (e.g., clothing size: S, M, L).
Describing Data: Distributions, Tables, and Graphs
Distribution of a Variable
The distribution of a variable describes how its values are spread or distributed among individuals in the dataset. It can be summarized using tables, graphs, and numerical measures.
Key Characteristics of a Dataset
Who? The individuals described by the data.
What? The variables measured and their definitions.
Why? The purpose of the data collection.
Graphical Displays
Bar Graphs: Used for categorical data; each bar represents a category, and its height shows frequency or percentage.
Pie Charts: Show the proportion of each category as a slice of a circle; best for displaying parts of a whole.
Histograms: Used for quantitative data; show the distribution of data across intervals (bins).
Example Table: Distribution Table for Ice Cream Flavors
Flavor | Number of Cartons |
|---|---|
Chocolate | 16 |
Strawberry | 5 |
Vanilla | 9 |
Exploratory Data Analysis (EDA)
Key Dataset Characteristics
Shape: The overall pattern of the distribution (e.g., symmetric, skewed, unimodal, bimodal).
Center: The central tendency (e.g., mean, median).
Spread: The variability or dispersion (e.g., range, interquartile range, standard deviation).
Outliers: Observations that fall outside the overall pattern.
Visualizing Distributions
Histograms: Useful for large datasets to visualize the pattern of variability.
Frequency: The count of observations in each category or interval.
Relative Frequency: The proportion of observations in each category or interval.
Populations, Samples, and Sampling
Sampling Methods
Simple Random Sample (SRS): Every individual has an equal chance of being selected.
Stratified Random Sample: The population is divided into strata, and a random sample is taken from each stratum.
Multistage Sample: Sampling is done in stages, often combining several methods.
Sampling Bias
Selection Bias: Some groups are systematically excluded.
Volunteer Bias: Individuals who volunteer may differ from the general population.
Measurement Bias: The measurement process skews results.
Summary Table: Types of Variables
Type | Subtypes | Examples |
|---|---|---|
Quantitative | Discrete, Continuous | Number of children, Height |
Qualitative | Nominal, Ordinal | Gender, Academic grade |
Images
 (Relevant for visualizing data distributions and types of graphs in statistics)
