 Indietro
Introductory Statistics Practice Exam Guidance: Probability, Random Variables, and Binomial Distributions
Guida di studio - Note intelligenti
 Appunti personalizzati basati sui tuoi materiali, ampliati con definizioni chiave, esempi e contesto.
Q11. In most applications, continuous random variables represent counted data, while discrete random variables represent measured data. True or False?
Background
Topic: Types of Random Variables
This question tests your understanding of the difference between discrete and continuous random variables, and how they relate to counted versus measured data.
Key Terms:
Discrete random variable: Takes on a countable number of distinct values (e.g., number of students in a class).
Continuous random variable: Can take on any value within a given range (e.g., height, weight, time).
Step-by-Step Guidance
Recall the definitions: Discrete random variables are associated with counting (e.g., number of heads in coin tosses), while continuous random variables are associated with measuring (e.g., length, temperature).
Evaluate the statement: Does it correctly match discrete with counted and continuous with measured?
If the statement is false, rewrite it so it correctly describes the relationship between discrete and continuous random variables.
Try solving on your own before revealing the answer!
Final Answer:
False; continuous random variables are measured data, and discrete random variables are counted data.

The correct relationship is that discrete random variables represent counted data, while continuous random variables represent measured data.
Q12. The expected value of a random variable can never be negative. True or False?
Background
Topic: Expected Value
This question tests your understanding of the expected value (mean) of a random variable and whether it can be negative.
Key Terms:
Expected value (): The theoretical average of a random variable, calculated as for discrete distributions.
Step-by-Step Guidance
Recall the formula for expected value: .
Consider whether the sum can be negative, depending on the values of and their probabilities.
Think about examples where the expected value might be negative (e.g., losses in a game).
Try solving on your own before revealing the answer!
Final Answer:
False; expected values represent a theoretical average and as such can be negative.

The expected value depends on the values and probabilities, so it can be negative if the outcomes are negative.
Q13. The mean of a random variable of a probability distribution describes how the outcomes vary. True or False?
Background
Topic: Mean and Standard Deviation of Probability Distributions
This question tests your understanding of what the mean and standard deviation represent in a probability distribution.
Key Terms:
Mean (): The expected value or theoretical average.
Standard deviation (): A measure of how much the outcomes vary from the mean.
Step-by-Step Guidance
Recall what the mean represents: It is the central value or expected value of the distribution.
Recall what the standard deviation represents: It measures the spread or variability of the outcomes.
Evaluate whether the mean describes variability or if another statistic does.
Try solving on your own before revealing the answer!
Final Answer:
False; the standard deviation of a random variable of a probability distribution describes how the outcomes vary.

The mean describes the central tendency, while the standard deviation describes the variability.
Q15. (b) Find the expected value and standard deviation for the given probability distribution.
Background
Topic: Expected Value and Standard Deviation for Discrete Probability Distributions
This question tests your ability to calculate the expected value (mean) and standard deviation for a discrete probability distribution using the provided counts and probabilities.
Key Formulas:
Expected value:
Variance:
Standard deviation:
Step-by-Step Guidance
Calculate the expected value by multiplying each value of by its probability and summing the results.
Calculate the variance by finding for each , multiplying by , and summing.
Take the square root of the variance to find the standard deviation .
Check your calculations for accuracy and ensure all probabilities sum to 1.
Try solving on your own before revealing the answer!
Final Answer:
Variance: Standard deviation:
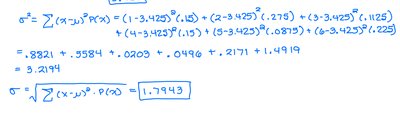
The variance and standard deviation were calculated using the formulas for discrete probability distributions.
Q16. (a) Can a binomial probability distribution be used to find the probability of winning r number of games out of 8? Why or why not?
Background
Topic: Binomial Probability Distribution
This question tests your understanding of the conditions required for a binomial probability distribution to be applicable.
Key Terms:
Binomial experiment: An experiment with a fixed number of independent trials, each with two possible outcomes (success or failure).
Random variable : Counts the number of successes in trials.
Step-by-Step Guidance
Check if the experiment has a fixed number of trials ().
Determine if each trial is independent and has the same probability of success.
Confirm that the random variable counts the number of successes.
Decide if these conditions match the requirements for a binomial distribution.
Try solving on your own before revealing the answer!
Final Answer:
Yes. Fixed number of independent trials, each measuring a success or failure where is a random variable counting the number of successes.

All conditions for a binomial probability distribution are satisfied in this scenario.
