 Indietro
Introductory Statistics Study Guide: Frequency Distributions, Graphs, and Descriptive Statistics
Guida di studio - Note intelligenti
 Appunti personalizzati basati sui tuoi materiali, ampliati con definizioni chiave, esempi e contesto.
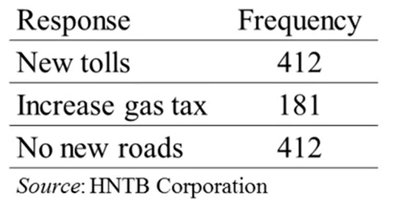
Q8a. Construct a relative frequency distribution for the survey responses about road construction payment preferences.
Background
Topic: Frequency and Relative Frequency Distributions
This question tests your ability to convert raw frequency counts into relative frequencies (proportions or percentages) for categorical data.
Key Terms and Formulas:
Frequency: The number of times a response occurs.
Relative Frequency: The proportion of the total responses for each category.
Formula:
Step-by-Step Guidance
Find the total number of responses by adding the frequencies for all categories.
For each response category (New tolls, Increase gas tax, No new roads), divide the frequency by the total number of responses to get the relative frequency.
Express the relative frequency as a decimal or percentage for each category.
Set up a table with the response categories and their corresponding relative frequencies.
Try solving on your own before revealing the answer!
Final Answer:
Total responses:
Relative frequencies:
New tolls: (41.0%)
Increase gas tax: (18.0%)
No new roads: (41.0%)
The relative frequency distribution shows the proportion of respondents for each payment preference.
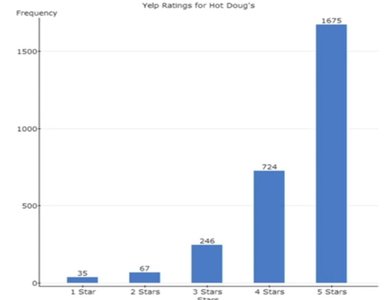
Q9a. Which was the most popular rating for Hot Doug’s Restaurant?
Background
Topic: Frequency Distribution and Mode
This question tests your ability to interpret a bar graph and identify the mode (most frequent value) in a categorical dataset.
Key Terms:
Mode: The value that appears most frequently in a dataset.
Frequency: The number of times each rating was given.
Step-by-Step Guidance
Examine the bar graph and note the frequency for each star rating (1 to 5 stars).
Identify which bar is the tallest, indicating the highest frequency.
The rating corresponding to the tallest bar is the mode, or most popular rating.
Try solving on your own before revealing the answer!
Final Answer:
The most popular rating for Hot Doug’s Restaurant is 5 Stars, with a frequency of 1675.
This is evident from the bar graph, where the 5 Star bar is the tallest.
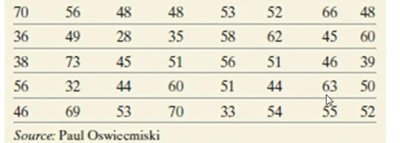
Q10a. Construct a frequency distribution for the serum HDL cholesterol data from 40 patients.
Background
Topic: Frequency Distribution for Quantitative Data
This question tests your ability to organize raw quantitative data into a frequency distribution table, grouping values into classes or intervals.
Key Terms and Formulas:
Frequency Distribution: A table that shows how many data values fall into each class interval.
Class Interval: A range of values used to group the data.
Steps:
Step-by-Step Guidance
List all the data values and determine the minimum and maximum values.
Decide on the number of classes (intervals) to use for the frequency distribution.
Calculate the class width:
Set up the class intervals and count how many data values fall into each interval.
Try solving on your own before revealing the answer!
Final Answer:
Example frequency distribution (using 5 classes):
28–39: 8 patients
40–51: 12 patients
52–63: 10 patients
64–75: 6 patients
76–87: 4 patients
The data is grouped into intervals, and the frequency for each interval is counted.
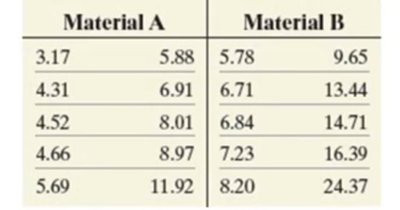
Q11a. Determine the sample mean failure times for each material (A and B).
Background
Topic: Measures of Central Tendency (Mean)
This question tests your ability to calculate the sample mean for two sets of quantitative data.
Key Terms and Formulas:
Sample Mean (): The average of the sample values.
Formula:
Step-by-Step Guidance
List all the failure times for Material A and Material B.
Add up all the values for each material to find the sum.
Count the number of values (n) for each material.
Divide the sum by the number of values to find the sample mean for each material.
Try solving on your own before revealing the answer!
Final Answer:
Material A mean:
Material B mean:
Material B has a higher mean failure time than Material A.
