 Indietro
Introductory Statistics Study Guide: Sampling, Descriptive Statistics, Probability, and Random Variables
Guida di studio - Note intelligenti
 Appunti personalizzati basati sui tuoi materiali, ampliati con definizioni chiave, esempi e contesto.
M01. Sampling and Distributions
Key Concepts in Sampling
Sampling is the process of selecting a subset (sample) from a larger group (population) to make statistical inferences. Understanding the types of variables and sampling methods is essential for accurate data collection and analysis.
Population: The entire group of individuals or items of interest.
Sample: A subset of the population selected for study.
Parameter: A numerical characteristic of the population (e.g., mean, proportion).
Statistic: A numerical characteristic calculated from the sample.
Sampling Bias: Systematic error due to non-representative samples.
Sampling Error: Random error from using a sample instead of the whole population.
Non-sampling Error: Errors not related to sampling, such as measurement errors.
Sampling Methods: Simple random, cluster, stratified, systematic, convenience sampling.
Variables: Characteristics measured in a study. They can be:
Categorical Variable: Qualitative, describes categories (e.g., gender, color).
Numerical Variable: Quantitative, measured numerically (e.g., height, age).
Discrete Quantitative Data: Countable values (e.g., number of medals).
Continuous Quantitative Data: Measured on a continuum (e.g., time, weight).
Levels of Measurement
Nominal: Categories without order (e.g., colors).
Ordinal: Ordered categories (e.g., rankings).
Interval: Ordered, equal intervals, no true zero (e.g., temperature).
Ratio: Ordered, equal intervals, true zero (e.g., height, weight).
Types of Graphs and Plots
Dot Plot: Displays individual data points.
Bar Graph: Compares categorical data.
Histogram: Shows frequency of numerical data in intervals.
Pareto Chart: Bar graph with bars ordered by frequency.
Pie Chart: Shows proportions of categories.
Line Graph: Displays data trends over time.
Stemplot: Shows data distribution using stems and leaves.
Measures of Center, Location, and Spread
Measures of Center: Mean, median, mode.
Measures of Location: Percentiles, quartiles.
Measures of Spread: Range, variance, standard deviation.
M02. Descriptive Statistics
Describing Data Distributions
Descriptive statistics summarize and describe the main features of a dataset. Common graphical and numerical methods are used to analyze data distributions.
Frequency: Number of times a value appears.
Relative Frequency: Proportion of times a value appears.
Cumulative Relative Frequency: Running total of relative frequencies.
Class Mark: Midpoint of a class interval.
Class Width: Difference between upper and lower class boundaries.
Outlier: Value far from others in the dataset.
Percentile: Value below which a given percentage of data falls.
Quartile: Divides data into four equal parts.
Mean, Median, and Mode
The mean, median, and mode are measures of central tendency used to describe the center of a data distribution.
Mean: Arithmetic average.
Median: Middle value when data is ordered.
Mode: Most frequently occurring value.
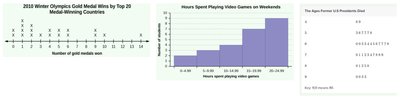
Example: The distributions shown in the image below illustrate different shapes and centers. The dot plot, histogram, and stemplot each provide insight into the mean, median, and mode of their respective datasets.
M03. Probability
Basic Probability Concepts
Probability quantifies the likelihood of events occurring. It is foundational for statistical inference and random variable analysis.
Probability:
Mutually Exclusive Events: Cannot occur together.
Independent Events: Occurrence of one does not affect the other.
Conditional Probability: Probability of one event given another.
Complement:
Probability Rules and Examples
Addition Rule:
Multiplication Rule: (if independent)
Sample Space: All possible outcomes.
Example: Calculating probabilities for random samples, such as the probability of drawing two balls of the same color from an urn, or analyzing survey data using Venn diagrams and probability rules.
M04. Discrete Random Variables
Definition and Properties
A discrete random variable takes on countable values, each with an associated probability. The probability distribution describes the likelihood of each value.
Expected Value (Mean):
Standard Deviation:
Probability Distribution: Table or function showing probabilities for each value.
Example: Calculating the expected number of times a newborn wakes its mother, or the probability distribution for developing pancreatic cancer in a sample.
M05. Continuous Random Variables
Uniform and Normal Distributions
Continuous random variables can take any value within an interval. The uniform distribution assigns equal probability to all values in a range, while the normal distribution is bell-shaped and characterized by its mean and standard deviation.
Uniform Distribution: for
Normal Distribution:
Percentile: Value below which a certain percentage of data falls.
Interquartile Range (IQR):
Example: Calculating probabilities and percentiles for smiling times of babies (uniform distribution) and ages of smartphone users (normal distribution).
Additional info: These notes expand on brief points from the original materials, providing definitions, formulas, and examples for clarity and completeness.
