 Indietro
Linear Regression: Concepts, Interpretation, and Statistical Significance
Guida di studio - Note intelligenti
 Appunti personalizzati basati sui tuoi materiali, ampliati con definizioni chiave, esempi e contesto.
Linear Regression
Least Squares: The Line of Best Fit
Linear regression is a statistical method used to model the relationship between two quantitative variables. The goal is to find the line that best fits the data, minimizing the sum of squared differences (residuals) between observed and predicted values.
Scatterplots are used to visualize the relationship between variables.
Direction: Indicates whether the relationship is positive or negative.
Form: Linear or nonlinear pattern.
Strength: How closely the data points follow the form.
Unusual features: Outliers or clusters.
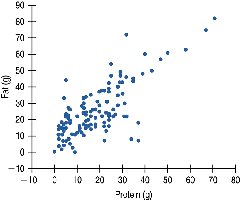
Example: Scatterplot of total fat versus protein for Burger King menu items.
Correlation Conditions
Before calculating correlation or fitting a regression line, certain conditions must be checked:
Quantitative Variables Condition: Both variables must be quantitative.
Straight Enough Condition: The relationship should be approximately linear.
No Outliers Condition: Outliers can distort the results.
The Linear Model
The linear regression model is expressed as:
b1 (Slope): Indicates the change in y for each unit increase in x.
b0 (Intercept): The value of y when x = 0.
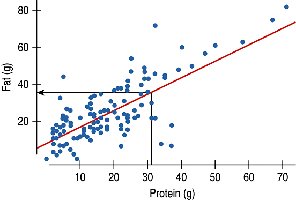
Example: For Burger King data, the slope is 0.91 grams of fat per gram of protein. This means for every additional gram of protein, there is an expected increase of 0.91 grams of fat.
Residuals
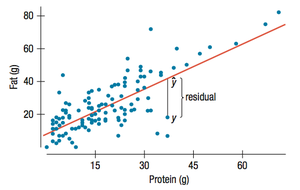
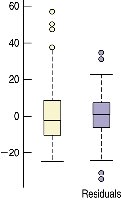
Residuals are the differences between observed values and the values predicted by the regression line. They are used to assess the fit of the model.
Residual:
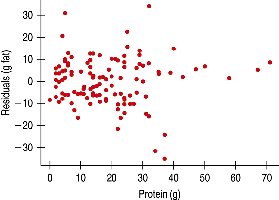
Residuals should be randomly distributed; patterns may indicate model inadequacy.
Illustration: Residual for a data point in the Burger King regression.
How Well Does Any Line Fit the Data?
The sum of residuals is not a reliable measure of fit, as positive and negative values can cancel out. Instead, the sum of squared residuals is minimized in least squares regression.
Interpreting the Coefficients
Interpretation depends on context. Sometimes, the intercept does not have a meaningful interpretation (e.g., predicting attendance with zero wins).
Slope: Rate of change of y with respect to x.
Intercept: Value of y when x = 0; may not always be meaningful.
Roles for Variables
In regression, the explanatory (predictor) variable is placed on the x-axis, and the response variable on the y-axis. The choice of which variable is x and which is y is critical.
Predictor (x): Variable used to predict.
Response (y): Variable being predicted.
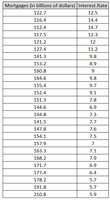
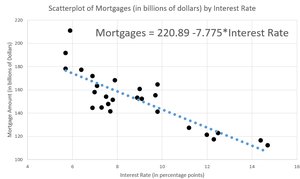
Interest Rates vs. Mortgages Example
Scatterplot and regression analysis of mortgage amounts versus interest rates.
Conditions for Regression
Regression requires the same conditions as correlation, plus one additional:
Quantitative Variables Condition
Straight Enough Condition
No Outliers Condition
Does the Plot Thicken? Condition: Residuals should have constant variance.
Examining the Residuals
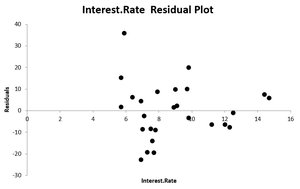
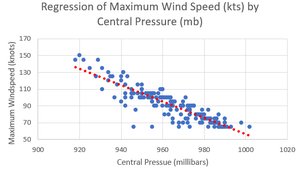
Residual plots help assess whether the regression model is appropriate. Ideally, residuals should be randomly scattered without patterns.
R2 – The Variation Accounted for by the Model
R2 (coefficient of determination) measures the proportion of variance in the response variable explained by the predictor variable.
R2 ranges from 0 to 1.
Higher R2 indicates a better fit.
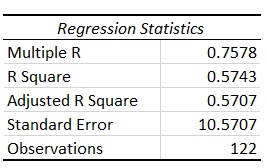
Example: For Burger King data, R2 = 0.5743, meaning 57.43% of the variation in fat is explained by protein.
Regression Output Interpretation
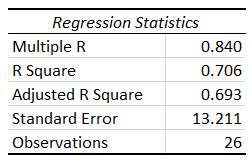
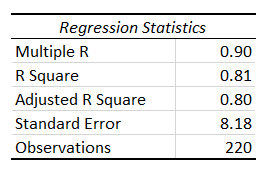
Regression output tables summarize key statistics:
Statistic | Meaning |
|---|---|
Multiple R | Correlation coefficient |
R Square | Proportion of variance explained |
Adjusted R Square | Adjusted for number of predictors |
Standard Error | Standard deviation of residuals |
Observations | Number of data points |
Regression Assumptions and Conditions
Review of regression conditions:
Quantitative Variables Condition
Straight Enough Condition
No Outliers Condition
Does the Plot Thicken? Condition
Using the Regression Equation to Make Predictions
Predictions should only be made within the range of the original data. Extrapolation outside this range can be inaccurate.
Statistical Significance of Linear Association
Statistical significance tests whether the observed linear association is likely due to chance. The p-value is used to make this determination.
Threshold: Commonly 0.05.
If p-value < threshold, the association is statistically significant.
If p-value > threshold, the association is likely due to random chance.
Example: Regression output for two spinners.


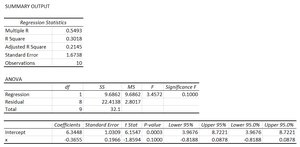
Summary Table: Regression Output Example
Statistic | Value |
|---|---|
Multiple R | 0.5893 |
R Square | 0.3478 |
Adjusted R Square | 0.2145 |
Standard Error | 1.196 |
Observations | 10 |
Interpretation: Since the p-value (0.1000) is greater than 0.05, the regression is not statistically significant.
Additional info: These notes cover the essentials of linear regression, including model fitting, interpretation, residual analysis, R2, and statistical significance, as relevant to introductory statistics.
