 Indietro
Measures of Position, Outliers, and Box Plots in Introductory Statistics
Guida di studio - Note intelligenti
 Appunti personalizzati basati sui tuoi materiali, ampliati con definizioni chiave, esempi e contesto.
Measures of Position and Outliers
Z-Score
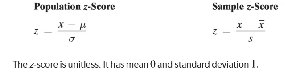
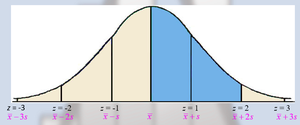
The z-score is a statistical measure that describes a data value's position relative to the mean of a distribution, expressed in terms of standard deviations. It allows comparison between values from different distributions by standardizing them.
Definition: The z-score represents the distance that a data value is from the mean, measured in standard deviations.
Formula: Population z-score: Sample z-score:
Properties: The z-score is unitless, has a mean of 0, and a standard deviation of 1.
Application: Used to identify how unusual or typical a value is within a distribution.
Example: Comparing Relative Positions
Suppose the mean upper arm length of 19-year-old males is 38.6 cm (SD = 2.9 cm), and for females, 35.8 cm (SD = 2.8 cm). To determine who has a relatively longer arm, calculate the z-score for each individual and compare.
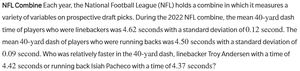
Example: NFL Combine
To compare the relative speed of two athletes in the 40-yard dash, use their z-scores based on their group means and standard deviations.
Example: Quality Control
In manufacturing, z-scores help set quality thresholds. For instance, bolts more than 2 standard deviations from the mean length are destroyed.

Percentiles
Percentiles indicate the relative standing of a value within a data set. The nth percentile is the value below which n% of the data fall.
Interpretation: If a score is at the 74th percentile, 74% of scores are equal to or less than that value.
Application: Used in standardized testing and other assessments to compare individual performance.
Example:
If the 95th percentile of newborn female length is 53.8 cm, then 95% of newborn females are shorter than 53.8 cm.
Quartiles
Quartiles divide an ordered data set into four equal parts:
First quartile (Q1): 25% of data fall on or below Q1.
Second quartile (Q2): 50% of data fall on or below Q2 (the median).
Third quartile (Q3): 75% of data fall on or below Q3.


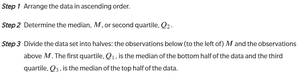
Finding Quartiles
Arrange the data in ascending order.
Determine the median (Q2).
Divide the data into halves; Q1 is the median of the lower half, Q3 is the median of the upper half.
Interquartile Range (IQR)
The interquartile range (IQR) measures the spread of the middle 50% of the data and is calculated as:
Formula:
Properties: IQR is resistant to outliers and is preferred for skewed distributions.
Example:
Given test scores, calculate Q1, Q2, Q3, and interpret the median, mean, and IQR. If the range is 46 and SD is 12.3, compare the resistance of IQR and SD to outliers.
Choosing Measures to Report
The choice of summary statistics depends on the shape of the distribution:
Median and IQR: Resistant to outliers; best for skewed distributions.
Mean, Range, and Standard Deviation: Not resistant to outliers; best for symmetric distributions.

Shape of Distribution | Measure of Central Tendency | Measure of Dispersion |
|---|---|---|
Symmetric | Mean | Standard Deviation |
Skewed left or right | Median | Interquartile Range |
The Five Number Summary and Box Plots
Five Number Summary
The five number summary consists of:
Smallest data value
First quartile (Q1)
Median (Q2)
Third quartile (Q3)
Largest data value
Box-and-Whisker Plot (Boxplot)
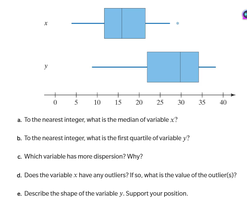
A boxplot is a graphical representation of the five number summary. It displays the spread and skewness of the data, and highlights outliers.
Whiskers: Extend from the box to the minimum and maximum values within the fences.
Box: Encloses Q1, Q2, and Q3.
Outliers: Values outside the fences are marked with asterisks (*).
Steps to Draw a Boxplot
Find the five-number summary.
Construct a scale and draw vertical lines at Q1, Q2, and Q3, enclosing them in a box.
Mark the lower and upper fences: Lower fence: Upper fence:
Draw whiskers to the minimum and maximum values within the fences.
Plot outliers with asterisks.
Identifying Outliers
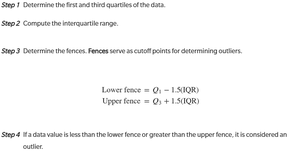
Outliers are values that fall outside the fences defined by the IQR:
Lower fence:
Upper fence:
If a value is less than the lower fence or greater than the upper fence, it is considered an outlier.
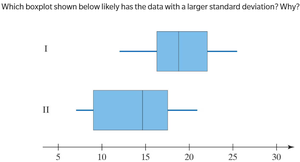
Boxplots and Distribution Shapes
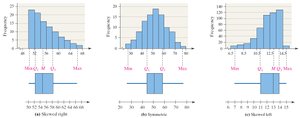
Boxplots can reveal the shape of a distribution:
Symmetric: Median is centered, whiskers are equal.
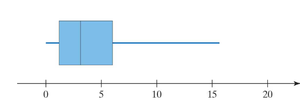
Skewed right: Median is left of center, right whisker is longer.
Skewed left: Median is right of center, left whisker is longer.
Example:
Given a five number summary (e.g., 60, 68, 77, 89, 98), draw a boxplot and interpret the distribution shape.
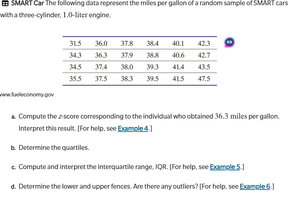
Application Example: Fuel Economy Data
Given a data set of miles per gallon for SMART cars:
Compute the z-score for a specific value.
Determine quartiles and IQR.
Identify outliers using fences.
Statistical Software: Drawing Boxplots
Statistical software (e.g., Statcrunch) can be used to create boxplots by selecting the variable, setting options for fences and orientation, labeling axes, and computing the plot.
Summary Table: Distribution Shape and Summary Statistics
Shape of Distribution | Measure of Central Tendency | Measure of Dispersion |
|---|---|---|
Symmetric | Mean | Standard Deviation |
Skewed left or right | Median | Interquartile Range |
Additional info:
These notes cover the essential concepts from Chapter 3: Numerically Summarizing Data, focusing on measures of position (z-score, percentiles, quartiles), resistance to outliers, and graphical summaries (boxplots). All examples and images directly reinforce the statistical concepts discussed.
