 Indietro
Measures of Relative Standing and Boxplots: Describing, Exploring, and Comparing Data
Guida di studio - Note intelligenti
 Appunti personalizzati basati sui tuoi materiali, ampliati con definizioni chiave, esempi e contesto.
Measures of Relative Standing and Boxplots
Introduction
This section explores statistical tools used to describe the position of individual data values within a data set. Key concepts include z scores, percentiles, quartiles, and the construction and interpretation of boxplots. These measures help compare data values, identify outliers, and summarize data distributions.
z Scores
Definition and Calculation
A z score (also called a standard score or standardized value) indicates how many standard deviations a data value (x) is above or below the mean. It is calculated as follows:
Sample z score:
Population z score:
Round z scores to two decimal places.
Properties of z Scores
A z score shows the number of standard deviations a value is from the mean.
z scores are unitless.
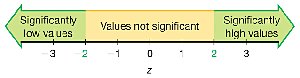
A value is significantly low if and significantly high if .
If a value is less than the mean, its z score is negative.
Example: Comparing Data Values
Suppose we compare a body temperature of 99°F and a quarter weighing 5.7790 g. By converting both to z scores, we find:
99°F: (1.29 standard deviations above the mean)
5.7790 g: (2.26 standard deviations above the mean)
The quarter's weight is more extreme relative to its data set.
Using z Scores to Identify Significant Values
Significantly low:
Significantly high:
Not significant:
For example, an earthquake magnitude of 4.01 with a mean of 2.572 and standard deviation of 0.651 yields , which is significantly high.
Percentiles
Definition and Interpretation
Percentiles divide a data set into 100 groups, each containing about 1% of the values. The kth percentile, , is the value below which k% of the data fall.
Finding the Percentile of a Data Value
To find the percentile for a value x:
Count the number of values less than x.
Divide by the total number of values, multiply by 100, and round to the nearest whole number.
Example: If 36 out of 50 wait times are less than 45 minutes, then 45 minutes is at the 72nd percentile ().
Notation
n: Total number of values
k: Percentile (e.g., for the 25th percentile, k = 25)
L: Locator (position in the sorted list)
Pk: kth percentile value
Converting a Percentile to a Data Value
To find the value at the kth percentile:
Compute
If L is not a whole number, round up to the next whole number. The value at this position is .
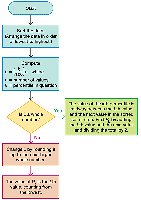
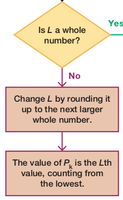
Example: For in a list of 50 values, ; round up to 13. The 13th value is $P_{25}$.
Quartiles
Definition and Description
Quartiles divide a data set into four groups, each containing about 25% of the values:
Q1: First quartile (same as ), separates the lowest 25% from the rest.
Q2: Second quartile (same as or the median), separates the lowest 50% from the highest 50%.
Q3: Third quartile (same as ), separates the lowest 75% from the highest 25%.
Note: There is not universal agreement on the exact procedure for calculating quartiles; results may vary by method or technology.
Statistics Defined Using Quartiles and Percentiles
Interquartile Range (IQR):
Semi-interquartile Range:
Midquartile:
10–90 Percentile Range:
5-Number Summary
Definition and Example
The 5-number summary consists of:
Minimum
First quartile ()
Median ()
Third quartile ()
Maximum
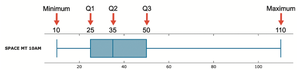
Example: For "Space Mountain" wait times, the 5-number summary is 10, 25, 35, 50, and 110 minutes.
Boxplots (Box-and-Whisker Diagrams)
Definition and Construction
A boxplot is a graphical summary of data based on the 5-number summary. It consists of a box from to , a line at the median (), and "whiskers" extending to the minimum and maximum values.
Find the 5-number summary.
Draw a line from the minimum to the maximum value.
Draw a box from to with a line at .
Skewness
Identifying Skewness with Boxplots
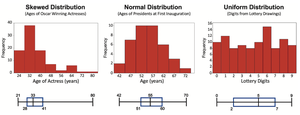
A distribution is skewed if it is not symmetric and extends more to one side. Boxplots can help identify skewness:
Skewed right: Longer whisker on the right
Skewed left: Longer whisker on the left
Symmetric: Whiskers of similar length
Identifying Outliers and Modified Boxplots
Procedure for Identifying Outliers
Find , ,
Compute
Calculate
A value is an outlier if it is below or above
Example: For "Space Mountain" data, , . Outliers are values ≤ -12.5 or ≥ 87.5. Thus, 105 and 110 are outliers.
Modified Boxplots
A modified boxplot marks outliers with a special symbol (e.g., asterisk) and extends the whiskers only to the most extreme non-outlier values.
