 Indietro
Normal Probability Distributions and Their Applications
Guida di studio - Note intelligenti
 Appunti personalizzati basati sui tuoi materiali, ampliati con definizioni chiave, esempi e contesto.
Normal Probability Distributions
Standard Normal Distribution
The standard normal distribution is a specific type of normal distribution that is symmetric and bell-shaped, with a mean (μ) of 0 and a standard deviation (σ) of 1. It is widely used in statistics for calculating probabilities and z-scores.
Bell-shaped: The graph is symmetric about the mean.
Mean (μ) = 0: The center of the distribution is at zero.
Standard deviation (σ) = 1: The spread of the distribution is standardized.
Formula for the normal distribution:
Notation:
: Probability that the z-score is between a and b.
: Probability that the z-score is greater than a.
: Probability that the z-score is less than a.
Uniform Distributions
A uniform distribution is a continuous probability distribution where all outcomes are equally likely within a certain range. The graph is a rectangle, and the area under the curve represents probability.
Area under the curve = 1
Area = height × width
Density Curves
The graph of any continuous probability distribution is called a density curve. The total area under a density curve is always 1, establishing a direct correspondence between area and probability.
Applications of the Normal Distribution
Z-Scores and Probability
A z-score measures how many standard deviations a value is from the mean. It is calculated as:
Graphs are helpful for visualizing normal distributions.
Do not confuse z-scores (horizontal axis) with areas (regions under the curve).
A z-score is negative if it is on the left side of the mean.
Probabilities (areas) are always between 0 and 1.
Critical Values
A critical value is a z-score that separates significantly low or high values from the rest of the distribution.
Significantly High or Low Values
Significantly high:
Significantly low:
Other thresholds (e.g., 0.01) may also be used depending on the context.
Finding Areas Under the Normal Curve
There are two common types of probability calculations with the normal distribution:
Cumulative area from the left: The area under the curve to the left of a specific z-score.
Area between two boundaries: The area under the curve between two z-scores (lower and upper boundaries).
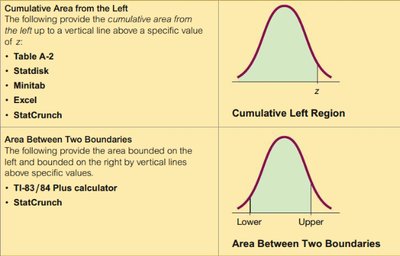
Statistical software and tables (e.g., Table A-2, Statdisk, Minitab, Excel, StatCrunch, TI-83/84 Plus calculator) are commonly used to find these areas.
Sampling Distributions and Estimators
Sampling Distribution of a Statistic
The sampling distribution of a statistic (such as the sample mean or sample proportion) is the probability distribution of that statistic when all possible samples of a given size are taken from the same population.
Sample proportion (): Distribution of sample proportions from all possible samples of size n.
Sample mean (): Distribution of sample means from all possible samples of size n.
Sample variance (): Distribution of sample variances from all possible samples of size n.
Behavior of Sample Statistics
Sample proportions and means tend to be normally distributed as sample size increases.
The mean of the sample means equals the population mean ().
The mean of the sample proportions equals the population proportion ().
The mean of the sample variances equals the population variance ().
Unbiased and Biased Estimators
Unbiased estimators: Sample proportion (), sample mean (), and sample variance ().
Biased estimators: Sample median, range, and sample standard deviation ().
Estimator: A statistic used to infer the value of a population parameter.
Unbiased estimator: A statistic whose sampling distribution has a mean equal to the population parameter.
The Central Limit Theorem (CLT)
Statement of the CLT
The Central Limit Theorem states that for all samples of size n > 30, the sampling distribution of the sample mean () can be approximated by a normal distribution with mean and standard deviation .
z-score for sample mean:
If the population is not normally distributed and n ≤ 30, the distribution of may not be well-approximated by a normal distribution.
Finite Population Correction
When sampling without replacement from a finite population and n > 0.05N, adjust the standard deviation:
Assessing Normality
Normal Quantile Plot
A normal quantile plot (or normal probability plot) graphs each data value against its expected z-score from the standard normal distribution. If the points are close to a straight line, the data are approximately normal.
Histogram: Should be bell-shaped for normality.
Outliers: More than one outlier suggests non-normality.
Normal quantile plot: Points should form a straight line for normality.
Normal Approximation to the Binomial Distribution
Conditions for Normal Approximation
Sample size n, probability of success p, and probability of failure q = 1 - p.
Requirements: and (sometimes 10 is recommended).
Parameters for the normal approximation:
Continuity correction: When approximating a discrete binomial with a continuous normal, represent a whole number x by the interval from x - 0.5 to x + 0.5.
Procedure for Using the Normal Approximation
Check that and .
Find and .
Apply the continuity correction to the value of x.
Use the normal distribution to find the desired probability.
Brief Review of Binomial Probability Distribution
Fixed number of trials (n)
Independent trials
Each trial is success or failure
Probability of success (p) remains constant
