 Indietro
Null Hypothesis Significance Testing, Effect Sizes, and Modern Issues in Statistical Inference
Guida di studio - Note intelligenti
 Appunti personalizzati basati sui tuoi materiali, ampliati con definizioni chiave, esempi e contesto.
Null Hypothesis Significance Testing (NHST)
Overview of NHST
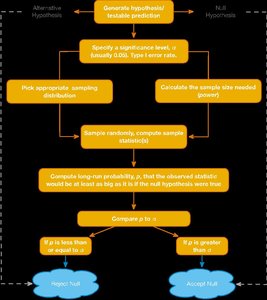
Null Hypothesis Significance Testing (NHST) is a foundational method in statistics for evaluating whether observed data provide sufficient evidence to reject a null hypothesis in favor of an alternative hypothesis. The process involves setting a significance level (alpha), collecting data, calculating a test statistic and p-value, and making a decision based on the comparison between p and alpha.
Null Hypothesis (H0): The default assumption, often that there is no effect or difference.
Alternative Hypothesis (Ha): The hypothesis that there is an effect or difference.
Alpha (α): The threshold for statistical significance, commonly set at 0.05.
p-value: The probability of observing data as extreme as those collected, assuming the null hypothesis is true.
Decision Rule: If p < α, reject H0; if p > α, fail to reject H0.
Misconceptions About p-values
There are several common misconceptions about p-values and statistical significance:
Misconception 1: A significant result means the effect is important. Reality: Significance depends on sample size; even trivial effects can be significant with large samples.
Misconception 2: A non-significant result means the null hypothesis is true. Reality: It only means the effect was not detected; it does not confirm the null hypothesis.
Misconception 3: A significant result means the null hypothesis is false. Reality: Statistical significance does not logically prove the null hypothesis is false.
All-or-Nothing Thinking in NHST
NHST often encourages binary thinking—results are either 'significant' or 'not significant.' This can lead to discarding potentially meaningful findings and ignoring effect sizes. Replication and context are crucial for proper interpretation.
Problems with NHST and Scientific Practice
Incentive Structures and Publication Bias
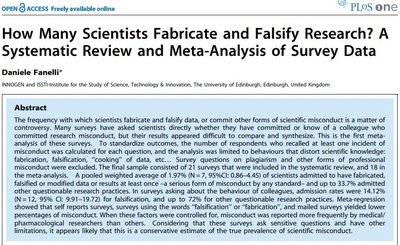
Scientific publication often favors significant, novel findings, leading to bias and potentially unethical practices. Researchers may be incentivized to produce positive results, which can distort the scientific record.
Researcher Degrees of Freedom
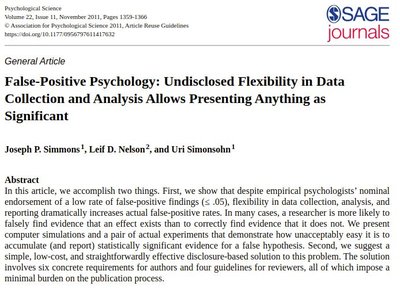
Researchers have many choices in study design and analysis, such as setting alpha, choosing sample size, selecting statistical models, and handling outliers. These choices can be manipulated to favor desired outcomes, a phenomenon known as 'researcher degrees of freedom.'
p-hacking and HARKing
p-hacking: Manipulating data or analyses to obtain significant p-values, such as selectively reporting outcomes or stopping data collection early.
HARKing: Presenting hypotheses formed after data collection as if they were specified before the study.
Confidence Intervals and Their Interpretation
Confidence Intervals for the Mean
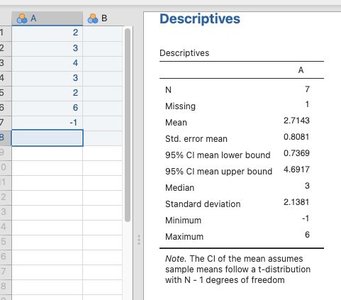
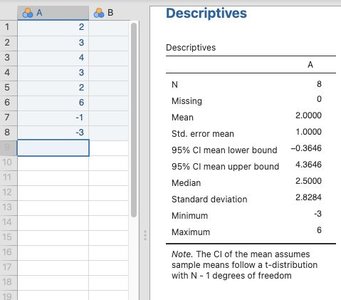
Confidence intervals (CIs) provide a range of plausible values for a parameter, such as the mean. If the CI does not include zero, it suggests evidence against the null hypothesis. However, CIs are sensitive to sample size and outliers.
Standard Error: Measures the variability of the sample mean.
95% CI: The interval within which the true mean is expected to fall 95% of the time.
The American Statistical Association (ASA) Statement on p-values
Key Points from the ASA Statement
p-values indicate incompatibility with the null hypothesis, not the probability that the null is true.
Scientific conclusions should not be based solely on whether a p-value crosses a threshold.
Full reporting and transparency are essential for valid inference.
p-values do not measure effect size or importance.
Context and other evidence are necessary for proper interpretation.
Solutions and Modern Approaches
Preregistration and Open Science
Preregistration involves publicly documenting study protocols before data collection, increasing transparency and reducing bias. Open science promotes sharing data and methods.

Effect Sizes
Effect sizes quantify the magnitude of an effect, providing more information than p-values alone. They are standardized, allowing comparison across studies, and are less dependent on sample size.
Cohen's d: Measures group differences.
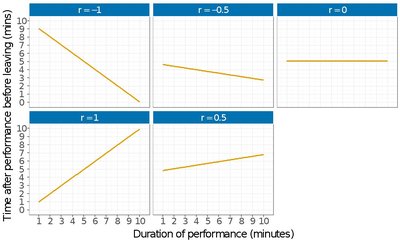
Pearson's r: Measures correlation.
Odds Ratio: Used for categorical data.
Cohen's d formula:
where is the pooled standard deviation.
Interpreting Effect Sizes
Small effect: r = .1, d = .2 (explains 1% of variance)
Medium effect: r = .3, d = .5 (explains 9% of variance)
Large effect: r = .5, d = .8 (explains 25% of variance)
Effect sizes should always be interpreted in the context of the research question.
Meta-Analysis
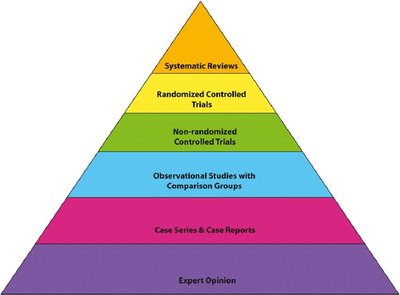
Meta-analysis combines effect sizes from multiple studies to estimate the overall population effect. Each study's effect size is weighted by its precision, with larger studies contributing more to the average.
Bayesian Estimation
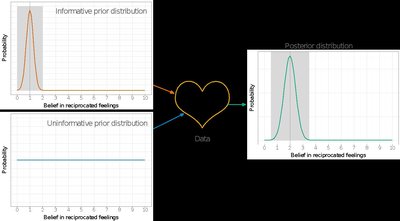
Bayesian methods provide an alternative to NHST, focusing on estimating parameter values and evaluating evidence for hypotheses. Bayesian approaches allow direct assessment of the probability of the null hypothesis and are less affected by sample size and stopping rules.
Bayes' Theorem: Updates beliefs based on new data.
Bayes Factor: Quantifies evidence for one hypothesis over another.
Practical Application: JAMOVI Exercises
Sample Size and Significance
Statistical software exercises demonstrate how sample size affects significance. Two samples of 20 showed no significant difference, but expanding to 26 samples resulted in significance. Small effects can become significant with large samples, highlighting the importance of effect size interpretation.
Summary Table: NHST vs. Modern Approaches
Approach | Key Feature | Strengths | Limitations |
|---|---|---|---|
NHST | Binary decision based on p-value | Widely used, simple | Encourages all-or-nothing thinking, sensitive to sample size |
Effect Sizes | Quantifies magnitude of effect | Standardized, interpretable | Context-dependent, can be manipulated |
Meta-Analysis | Combines results across studies | Estimates population effect | Requires rigorous study selection |
Bayesian | Estimates probability of hypotheses | Flexible, interpretable | Requires prior specification |
Additional info: These notes expand on the original content by providing definitions, formulas, and context for each statistical concept, ensuring a comprehensive and self-contained study guide for introductory statistics students.
