 Indietro
Numerical Summaries of Center and Variation: The Empirical Rule and z-Scores
Guida di studio - Note intelligenti
 Appunti personalizzati basati sui tuoi materiali, ampliati con definizioni chiave, esempi e contesto.
Numerical Summaries of Center and Variation
The Empirical Rule
The Empirical Rule is a guideline used in statistics to describe the spread of data in a unimodal and symmetric distribution. It provides a quick way to estimate the proportion of data within certain distances from the mean, measured in standard deviations.
Approximately 68% of the observations are within 1 standard deviation of the mean.
Approximately 95% of the observations are within 2 standard deviations of the mean.
Nearly all of the observations are within 3 standard deviations of the mean.
This rule is especially useful for quickly assessing what values are typical or unusual in a dataset, provided the distribution is roughly symmetric and unimodal.
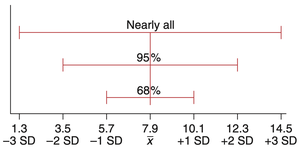
Example: Smog Levels Suppose the mean particulate level in a sample of cities is 7.9 micrograms per cubic meter, with a standard deviation of 2.2 micrograms per cubic meter. Applying the Empirical Rule:
About 68% of cities have smog levels between 5.7 and 10.1 (mean ± 1 SD).
About 95% of cities have smog levels between 3.5 and 12.3 (mean ± 2 SD).
Nearly all cities have smog levels between 1.3 and 14.5 (mean ± 3 SD).
Key Point: The Empirical Rule is an approximation and works best for large, unimodal, and symmetric datasets. Actual percentages may vary slightly in real data.
Determining If a Data Value Is Unusual
Values that fall outside the range covered by 95% of the data (i.e., more than 2 standard deviations from the mean) are considered unusual. For symmetric distributions, about 2.5% of values are unusually low, and 2.5% are unusually high.
Example: Temperatures in San Francisco If 95% of daily high temperatures are between certain values, then only 5% of days are outside this range. Thus, a temperature colder than the lower bound is fairly unusual.
z-Scores
A z-score is a standardized measure that indicates how many standard deviations a data value is from the mean. It allows for comparison across different datasets or variables, even if they have different units or scales.
A z-score of 1.5 means the value is 1.5 standard deviations above the mean.
A z-score of -1.5 means the value is 1.5 standard deviations below the mean.
The formula for the z-score is:
where: = observed value = sample mean = sample standard deviation
z-Scores in Context
z-scores are useful for:
Comparing values from different groups (e.g., exam scores from different tests).
Comparing values measured in different units (e.g., inches and pounds).
Identifying unusual values (those with z-scores greater than 2 or less than -2).
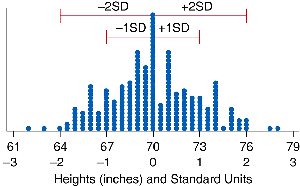
Example: In a sample of men's heights, two men have z-scores greater than 2, and two men have z-scores less than -2, indicating their heights are unusually high or low compared to the group.
Comparing z-Scores: Example
Maria scored 80 on her first statistics exam (mean = 70, SD = 10) and 85 on her second exam (mean = 80, SD = 5). Her z-scores are:
First exam:
Second exam:
Maria performed equally well on both exams relative to her classmates, as her z-score was 1 in both cases.
Snapshot: The z-Score
What is it? | A standardized observation |
|---|---|
What does it do? | Converts a measurement into standard units |
How does it do it? | Measures how many standard deviations away a value is from the mean |
How is it used? | To compare values from different groups or units |
