Indietro
Numerically Summarizing Data: Measures of Central Tendency, Dispersion, and Position
Guida di studio - Note intelligenti
 Appunti personalizzati basati sui tuoi materiali, ampliati con definizioni chiave, esempi e contesto.
Measures of Central Tendency
Arithmetic Mean
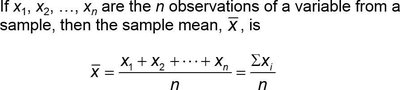
The arithmetic mean is a measure of central tendency that represents the average value in a data set. It is calculated by summing all the values and dividing by the number of observations. The mean can be computed for both populations and samples.
Population Mean (μ): Uses all individuals in a population and is considered a parameter.
Sample Mean (\(\bar{x}\)): Uses a subset (sample) of the population and is considered a statistic.
Formula:
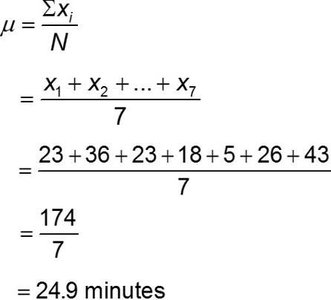
Example: For the data set 23, 36, 23, 18, 5, 26, 43, the population mean is 24.9 minutes.
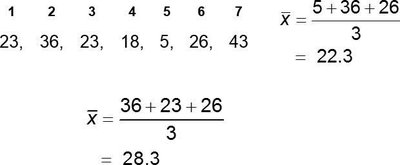
Additional info: Sample means may vary between different random samples from the same population.
Median
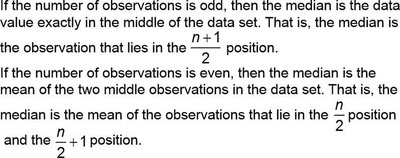
The median is the value that lies in the middle of the data when arranged in ascending order. It divides the data into two equal halves.
Odd number of observations: Median is the middle value.
Even number of observations: Median is the mean of the two middle values.
Formula:
If n is odd: Median position = If n is even: Median = mean of values at positions and
Example (Odd n): For n = 7, median is the 4th value in the ordered set: 5, 18, 23, 23, 26, 36, 43. Median = 23.

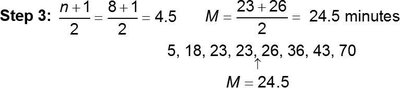
Example (Even n): For n = 8, median is the mean of the 4th and 5th values: 5, 18, 23, 23, 26, 36, 43, 70. Median = (23+26)/2 = 24.5.
Resistance of Statistics
A statistic is resistant if it is not substantially affected by extreme values (outliers). The median is resistant, while the mean is not.
Example: Adding an extreme value (e.g., 130 minutes) to the data set increases the mean more than the median.
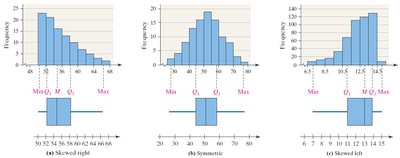
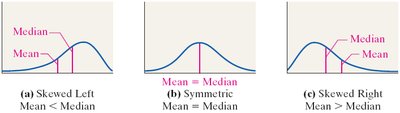
Relation to Distribution Shape:
Distribution Shape | Mean vs. Median |
|---|---|
Skewed left | Mean < Median |
Symmetric | Mean ≈ Median |
Skewed right | Mean > Median |
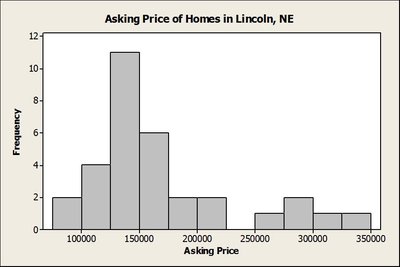
Example: Histogram of home prices shows a right-skewed distribution, where mean > median.
Mode
The mode is the most frequent observation in a data set. A data set can have no mode, one mode, or multiple modes.
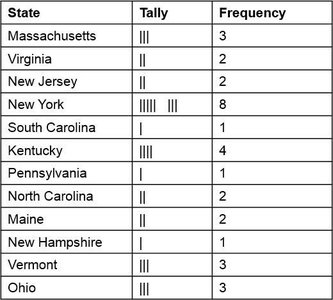
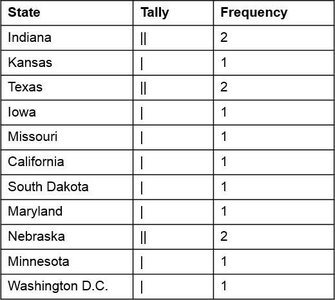
Example: Mode of Vice Presidents' state of birth is New York (most frequent).
State | Tally | Frequency |
|---|---|---|
Massachusetts | ||| | 3 |
Virginia | || | 2 |
New Jersey | || | 2 |
New York | |||| |||| | 8 |
South Carolina | | | 1 |
Kentucky | |||| | 4 |
Pennsylvania | | | 1 |
North Carolina | || | 2 |
Maine | || | 2 |
New Hampshire | | | 1 |
Vermont | ||| | 3 |
Ohio | ||| | 3 |
State | Tally | Frequency |
|---|---|---|
Indiana | || | 2 |
Kansas | | | 1 |
Texas | || | 2 |
Iowa | | | 1 |
Missouri | | | 1 |
California | | | 1 |
South Dakota | | | 1 |
Maryland | | | 1 |
Nebraska | || | 2 |
Minnesota | | | 1 |
Washington D.C. | | | 1 |
Comparison of Central Tendency Measures
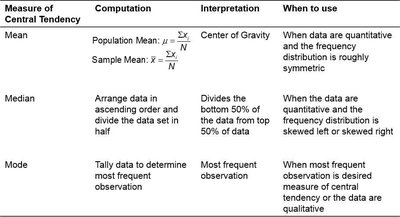
The following table summarizes the computation, interpretation, and appropriate use of mean, median, and mode:
Measure | Computation | Interpretation | When to use |
|---|---|---|---|
Mean |
| Center of Gravity | Quantitative data, symmetric distribution |
Median | Arrange data, find middle | Divides bottom 50% from top 50% | Quantitative data, skewed distribution |
Mode | Tally most frequent | Most frequent observation | Qualitative data or most frequent desired |
Measures of Dispersion
Range
The range is the difference between the largest and smallest values in a data set.
Formula:
Example: For 23, 36, 23, 18, 5, 26, 43, Range = 43 - 5 = 38 minutes.
Standard Deviation
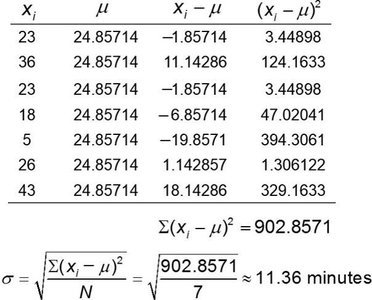
The standard deviation measures the spread of data values around the mean. It is the square root of the mean of the squared deviations from the mean.
Population Standard Deviation (σ):
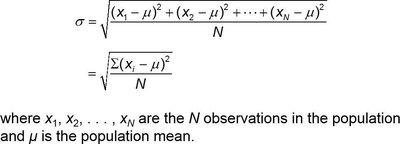
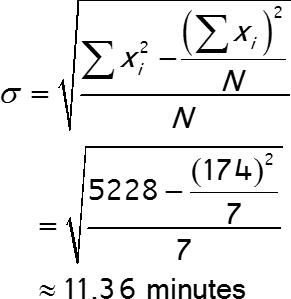
Computational formula:
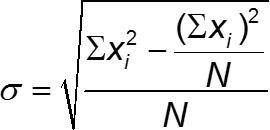
Example: For the travel time data, σ ≈ 11.36 minutes.
Sample Standard Deviation (s):
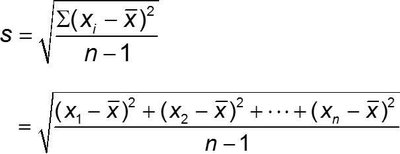
Computational formula:
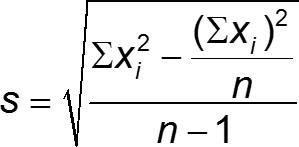
Example: For sample data 5, 26, 36, s ≈ 15.82 minutes.
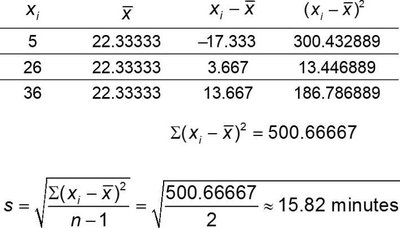
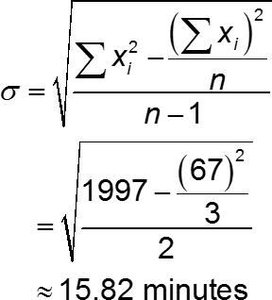
Additional info: The denominator n-1 is called degrees of freedom.
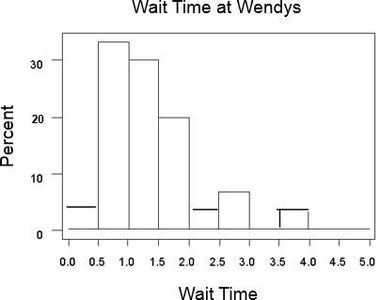
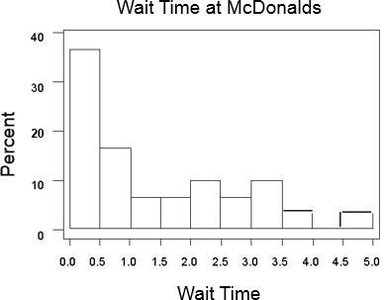
Comparison Example: Standard deviation for Wendy's wait time is 0.738 minutes, for McDonald's is 1.265 minutes. McDonald's data is more dispersed.
Variance
The variance is the square of the standard deviation. It quantifies the average squared deviation from the mean.
Population Variance:
Sample Variance:
Example: For travel time data, population variance = 129.05 minutes2, sample variance = 250.27 minutes2.
Empirical Rule (for Bell-Shaped Distributions)
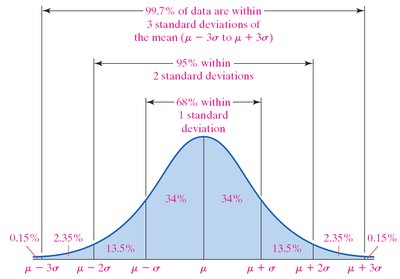
The Empirical Rule describes the spread of data in a normal (bell-shaped) distribution:
68% of data within 1 standard deviation of mean
95% within 2 standard deviations
99.7% within 3 standard deviations
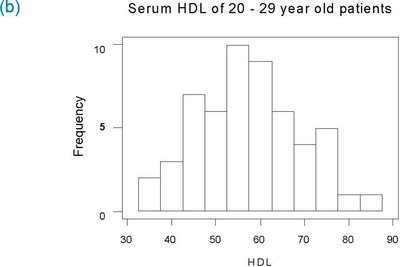
Example: For serum HDL cholesterol, histogram confirms bell-shaped distribution.
Chebyshev's Inequality
Chebyshev's Inequality applies to any data set, regardless of shape. It states that at least of the data lies within k standard deviations of the mean, for k > 1.
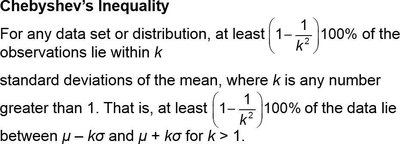
Example: For k = 3, at least 89% of data lies within 3 standard deviations.

Measures of Position and Outliers
z-Scores
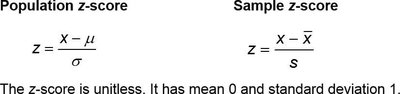
A z-score measures how many standard deviations a data value is from the mean. It is unitless and allows comparison across different distributions.
Population z-score:
Sample z-score:
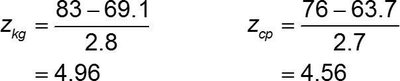
Example: Kevin Garnett's height: ; Candace Parker's height:
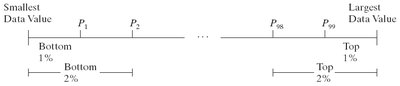
Percentiles
The kth percentile is the value below which k percent of the data falls. Percentiles are used to interpret relative standing in a data set.
Example: A GRE score at the 70th percentile means the applicant scored higher than 70% of test-takers.
Quartiles
Quartiles divide data into four equal parts:
Q1: 25th percentile
Q2: 50th percentile (median)
Q3: 75th percentile

Example: For vehicle speeds: Q1 = 28, Q2 = 32.5, Q3 = 38 mph.
Interquartile Range (IQR)
The interquartile range (IQR) measures the spread of the middle 50% of data. It is calculated as:
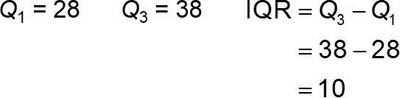
Example: IQR = 38 - 28 = 10 mph.
Checking for Outliers
Outliers are values that fall outside the expected range. To check for outliers:
Compute lower fence:
Compute upper fence:
Values outside these fences are outliers.
The Five-Number Summary and Boxplots
Five-Number Summary
The five-number summary consists of: minimum, Q1, median (Q2), Q3, and maximum.
Example: For credit card interest rates: 6.5%, 12.0%, 13.6%, 14.4%, 14.5%
Boxplots
A boxplot visually displays the five-number summary and identifies outliers.
Draw a box from Q1 to Q3, with a line at the median.
Whiskers extend to minimum and maximum values within the fences.
Outliers are marked with asterisks.

Additional info: Boxplots can be used to describe the shape of a distribution (skewed, symmetric).