 Indietro
Organizing and Summarizing Data: Introductory Statistics Study Notes
Guida di studio - Note intelligenti
 Appunti personalizzati basati sui tuoi materiali, ampliati con definizioni chiave, esempi e contesto.
Organizing and Summarizing Data
Organizing Qualitative Data
Frequency Distributions
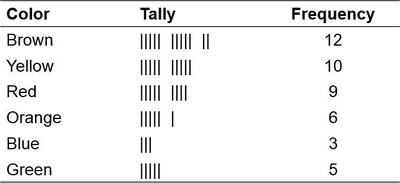
Qualitative data, such as survey responses or categorical variables, must be organized to facilitate analysis. A frequency distribution lists each category and the number of occurrences for each category. This is the first step in transforming raw data into meaningful information.
Raw Data: Unorganized data collected from surveys or experiments.
Frequency Table: A table showing categories, tally marks, and frequencies.
Example: The frequency distribution of M&M colors in a sample bag.
Relative Frequency Distributions
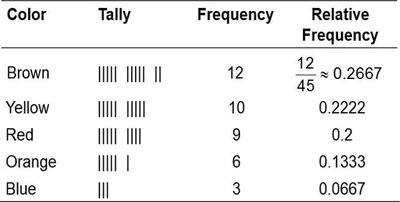
The relative frequency is the proportion or percentage of observations within a category. It is calculated as:
Relative frequencies allow comparison between groups of different sizes.
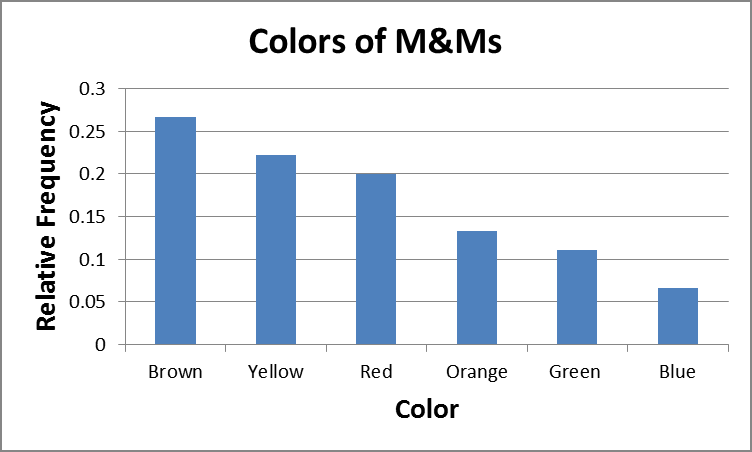
Example: Relative frequency distribution for M&M colors.
Bar Graphs
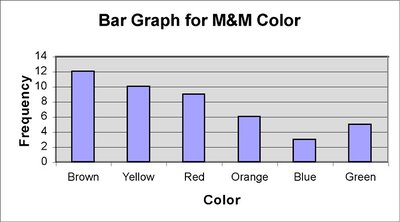
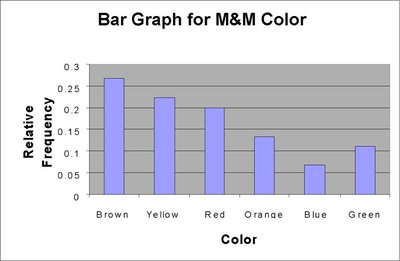
A bar graph visually represents categorical data. Each bar's height corresponds to the frequency or relative frequency of a category. Bars are of equal width and do not touch.
Bar graphs can display frequencies or relative frequencies.
Categories are labeled on one axis; frequencies on the other.
Example: Bar graph for M&M color frequencies.
Example: Bar graph for M&M color relative frequencies.
Pareto Charts
A Pareto chart is a bar graph with bars arranged in decreasing order of frequency or relative frequency. It highlights the most common categories.
Side-by-Side Bar Graphs
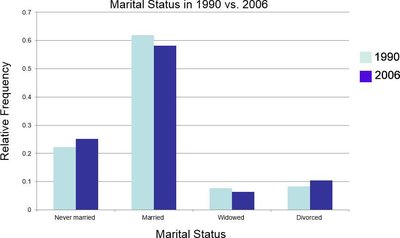
Side-by-side bar graphs compare two or more data sets, often using relative frequencies to account for different sample sizes.
Example: Comparison of marital status in 1990 vs. 2006.
Horizontal Bar Graphs
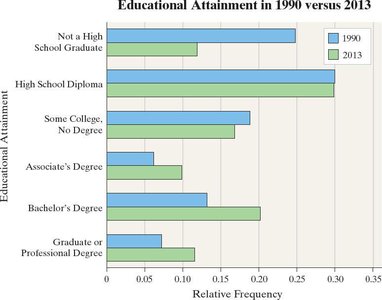
Horizontal bar graphs are used when category names are lengthy, improving readability.
Pie Charts
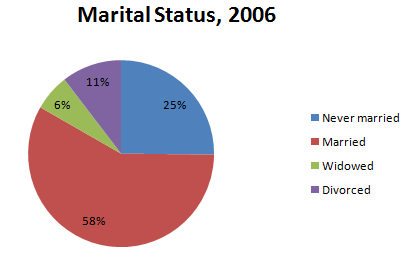
A pie chart divides a circle into sectors, each representing a category. The area of each sector is proportional to the category's frequency.
Useful for showing parts of a whole.
Example: Pie chart for marital status in 2006.
Organizing Quantitative Data: Popular Displays
Discrete Data Tables
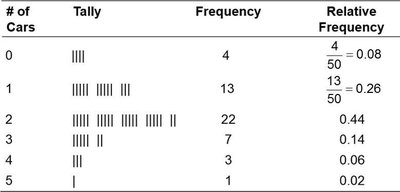
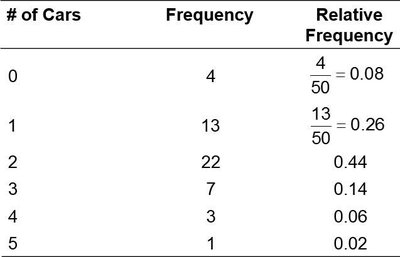
Discrete quantitative data can be organized in frequency and relative frequency tables. Each value or class is listed with its frequency.
Histograms of Discrete Data
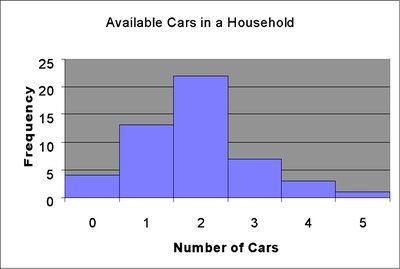
A histogram is a graphical display of quantitative data. Rectangles represent classes; their height shows frequency or relative frequency. Unlike bar graphs, rectangles touch.
Continuous Data Tables
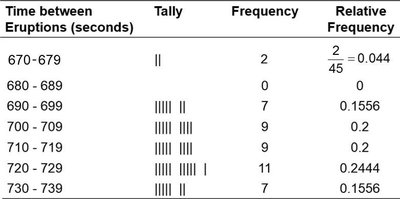
Continuous data are grouped into classes (intervals). Each class has a lower and upper limit, and a class width. Frequency and relative frequency tables summarize the data.
Histograms of Continuous Data
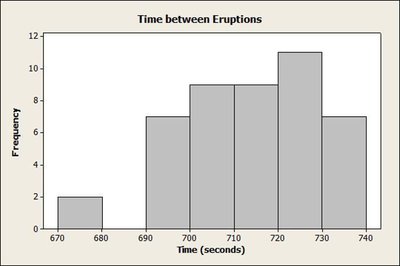
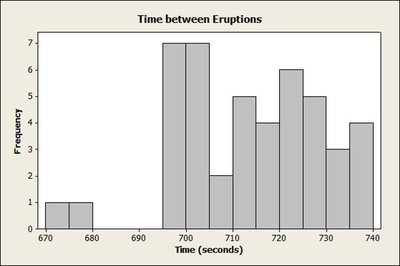
Histograms for continuous data use class intervals. The choice of class width affects the appearance and interpretability of the histogram.
Stem-and-Leaf Plots
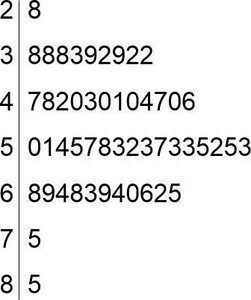
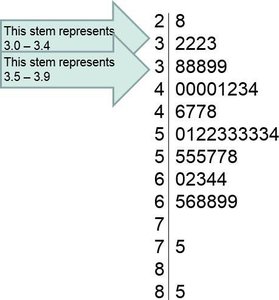
A stem-and-leaf plot displays quantitative data by splitting each value into a "stem" (all but the last digit) and a "leaf" (last digit). It preserves the original data and shows distribution shape.
Stems are listed vertically; leaves are listed horizontally.
Split stems can be used for better visualization when data are bunched.
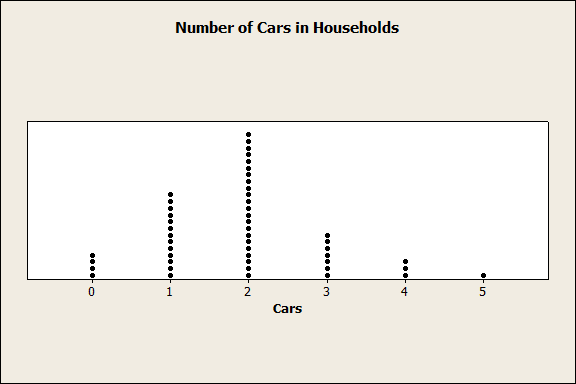
Dot Plots
A dot plot places dots above each value in a data set, showing frequency and distribution shape.
Identifying the Shape of a Distribution
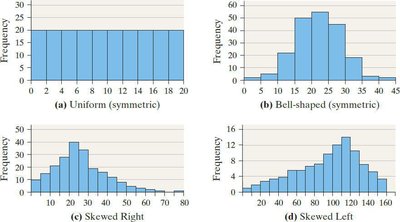
Distributions can be classified by their shape:
Uniform: Frequencies are evenly spread.
Bell-shaped: Highest frequency in the middle, tails off at both ends.
Skewed Right: Right tail is longer.
Skewed Left: Left tail is longer.
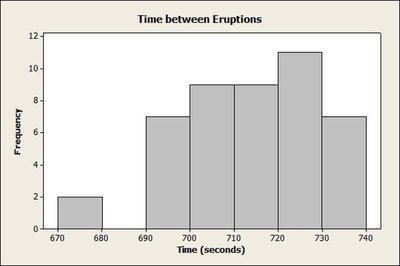
Example: Histogram for time between eruptions at Old Faithful.
Additional Displays of Quantitative Data
Frequency Polygons
A frequency polygon uses points connected by lines to represent class frequencies. Points are plotted above class midpoints.
Class midpoint:
Cumulative Frequency and Relative Frequency Tables
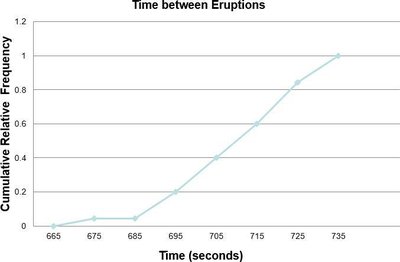
Cumulative frequency tables show the total number of observations less than or equal to each class. Cumulative relative frequency tables show the proportion or percentage.
Ogives
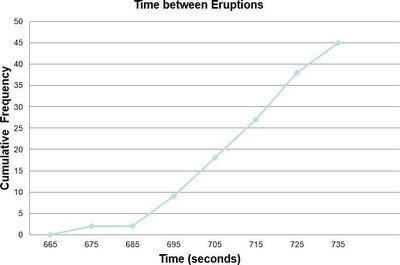
An ogive is a graph of cumulative frequency or cumulative relative frequency. Points are plotted at upper class limits and connected by lines.
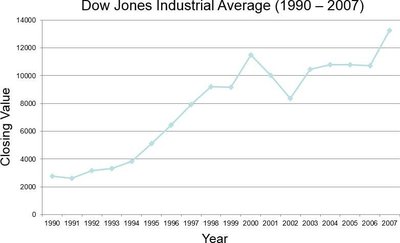
Time Series Graphs
Time series graphs plot data measured at different points in time. The horizontal axis represents time; the vertical axis represents the variable's value.
Summary Table: Types of Data Displays
Type | Purpose | Data Type |
|---|---|---|
Frequency Table | Summarize counts | Qualitative/Discrete Quantitative |
Relative Frequency Table | Show proportions | Qualitative/Discrete Quantitative |
Bar Graph | Visualize categories | Qualitative |
Pareto Chart | Highlight most frequent | Qualitative |
Pie Chart | Show parts of whole | Qualitative |
Histogram | Show distribution | Quantitative |
Stem-and-Leaf Plot | Preserve raw data | Quantitative |
Dot Plot | Show frequency | Quantitative |
Frequency Polygon | Show distribution shape | Quantitative |
Ogive | Cumulative frequency | Quantitative |
Time Series Graph | Show trends over time | Quantitative (time series) |
Additional info: These notes cover Chapter 2 topics: organizing and summarizing data, including qualitative and quantitative data displays, and are directly relevant to introductory statistics.
