 Indietro
Probability Distributions and Estimation in Elementary Statistics
Guida di studio - Note intelligenti
 Appunti personalizzati basati sui tuoi materiali, ampliati con definizioni chiave, esempi e contesto.
Probability Distributions
Introduction to Probability
Probability is the measure of the likelihood that an event will occur. It is not a guarantee but a quantification of uncertainty. For example, a 20% chance of rain does not mean it will definitely rain or not rain; it simply expresses the likelihood.
Probability values range from 0 (impossible) to 1 (certain).
Random Variables and Probability Distributions
A random variable is a variable whose value is determined by chance. Probability distributions describe the probabilities for each value of a random variable.
Discrete random variable: Takes countable values (e.g., number of heads in coin tosses).
Continuous random variable: Takes infinitely many values, not countable (e.g., body temperature).
Requirements for Probability Distributions
Random variable x is numerical and associated with probabilities.
The sum of all probabilities is 1:
Each probability is between 0 and 1:
Example: Probability Distribution for Two Births
Let x = number of females in two births. The probability distribution is:
x | P(x) |
|---|---|
0 | 0.25 |
1 | 0.50 |
2 | 0.25 |
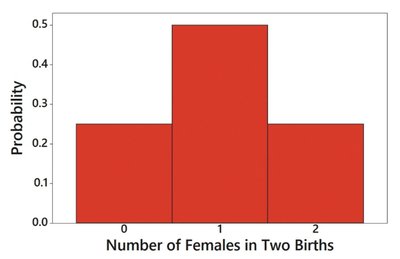
Probability Histogram
A probability histogram visually represents a probability distribution, with the vertical axis showing probabilities.
Parameters of a Probability Distribution
Mean (μ):
Variance (σ²): or
Standard deviation (σ):
Expected value (E):
Significant Values and the Range Rule of Thumb
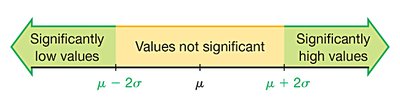
To identify significantly low or high values:
Significantly low: or lower
Significantly high: or higher
Not significant: Between and
Binomial Probability Distributions
Definition and Requirements
A binomial probability distribution arises from a procedure with:
Fixed number of trials (n)
Independent trials
Two possible outcomes per trial (success/failure)
Constant probability of success (p) and failure (q = 1 - p)
Notation
n: Number of trials
x: Number of successes
p: Probability of success
q: Probability of failure
P(x): Probability of exactly x successes
Binomial Probability Formula
The probability of getting exactly x successes in n trials:
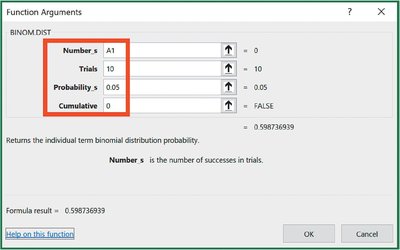
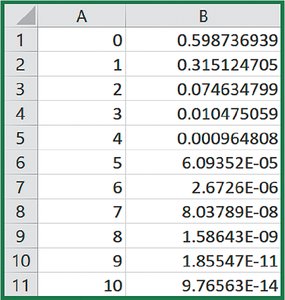
Finding Binomial Probabilities Using Technology
Excel and other software can compute binomial probabilities efficiently.

Mean and Standard Deviation of Binomial Distributions
Mean:
Variance:
Standard deviation:
Normal Probability Distributions
Standard Normal Distribution
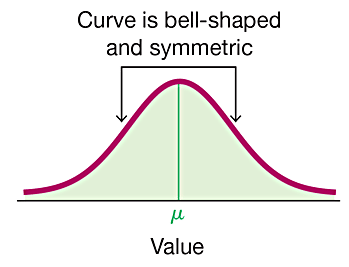
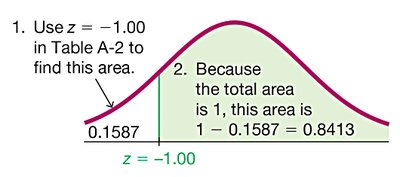
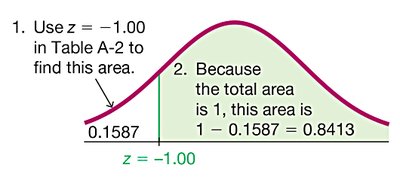
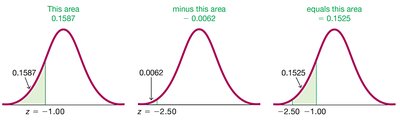
The standard normal distribution is a bell-shaped, symmetric distribution with mean 0 and standard deviation 1. Probabilities correspond to areas under the curve.
Uniform Distribution
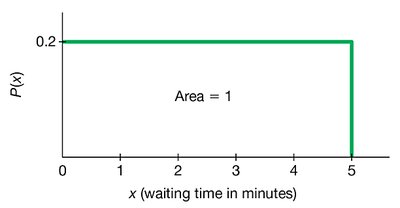
A uniform distribution has values equally spread over the range, resulting in a rectangular graph. The area under the curve equals 1.
Finding Probabilities with z Scores
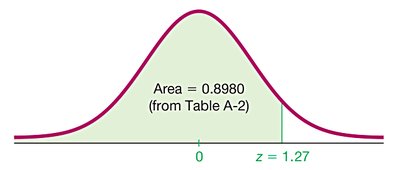
z score:
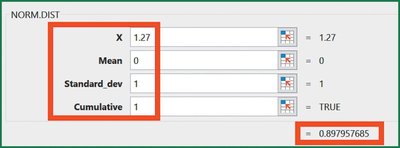
Use technology or tables to find areas (probabilities) for regions under the normal curve.
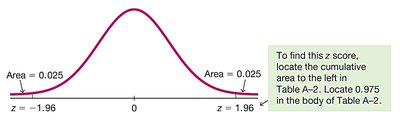
Critical Values
Critical values are z scores that separate significant from non-significant results. For a 95% confidence level, the critical value is .
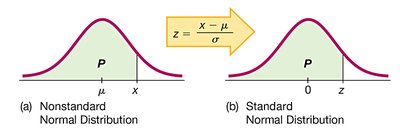
Converting Nonstandard to Standard Normal Distributions
Any normal distribution can be standardized using the z score formula:
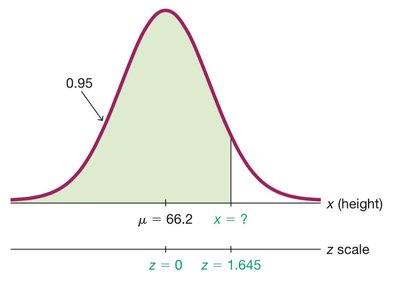
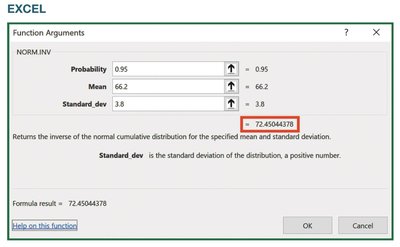
Finding Values from Known Areas
Given a probability (area), use the inverse normal function (e.g., Excel's NORM.INV) to find the corresponding x value.
Estimating Parameters and Determining Sample Sizes
Estimating a Population Proportion
Point estimate: The sample proportion is the best estimate of the population proportion p.
Confidence interval: A range of values likely to contain the population parameter.
Margin of error (E):
Confidence interval for p:
Confidence Level | α | Critical Value |
|---|---|---|
90% | 0.10 | 1.645 |
95% | 0.05 | 1.96 |
99% | 0.01 | 2.575 |
Determining Sample Size for Proportions
If is known:
If is unknown:
Always round up to the next whole number.
Estimating a Population Mean (σ Not Known)
Point estimate: The sample mean is the best estimate of the population mean μ.
Confidence interval:
Margin of error (E): (use t-distribution with df = n - 1)
Determining Sample Size for Means
If σ is unknown, estimate using range/4 or prior studies.
Summary Table: Choosing the Correct Distribution
Condition | Method |
|---|---|
σ not known, normal population or n > 30 | Student t distribution |
σ known, normal population or n > 30 | Normal (z) distribution |
Population not normal, n ≤ 30 | Nonparametric or bootstrapping methods |
Key Terms and Concepts
Random variable: Variable whose value is determined by chance.
Probability distribution: Table, formula, or graph showing probabilities for each value of a random variable.
Binomial distribution: Probability distribution for a fixed number of independent trials with two outcomes.
Normal distribution: Symmetric, bell-shaped distribution described by mean and standard deviation.
Confidence interval: Range of values used to estimate a population parameter.
Margin of error: Maximum likely difference between sample statistic and population parameter.
Critical value: Value that separates significant from non-significant results in hypothesis testing or estimation.
