 Indietro
Regression, $R^2$, and Extrapolation: Key Concepts and Pitfalls
Guida di studio - Note intelligenti
 Appunti personalizzati basati sui tuoi materiali, ampliati con definizioni chiave, esempi e contesto.
7.6 The Variation Accounted for by the Model ()
Understanding (Coefficient of Determination)
The coefficient of determination, , quantifies the proportion of the variance in the dependent variable that is predictable from the independent variable(s) using a regression model. It is a key measure of how well the regression line fits the data.
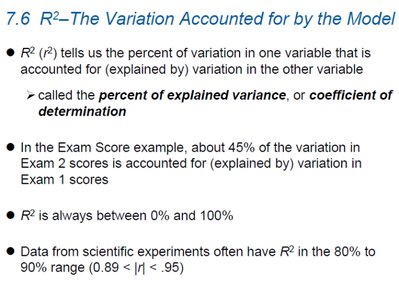
Definition: is the percent of variation in one variable explained by variation in the other variable. It is also called the percent of explained variance or coefficient of determination.
Formula: , where is the correlation coefficient.
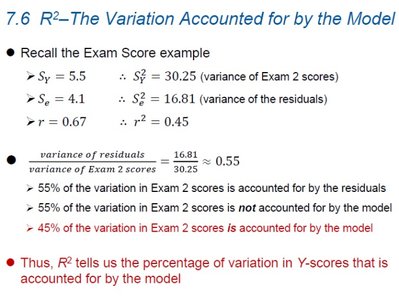
Interpretation: An of 0.45 means 45% of the variation in is explained by the model; the remaining 55% is unexplained (residual).
Range: is always between 0% and 100%.
Scientific Data: Experiments often yield high values (80–90%).
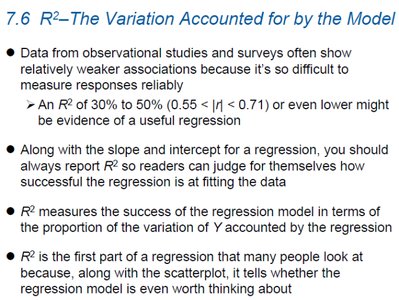
Observational Data: Lower values (30–50%) can still indicate useful regression, especially when measuring responses is difficult.
Reporting: Always report with regression results to allow assessment of model fit.
Example: Exam Score Regression
Given: , (variance of Exam 2 scores), , (variance of residuals), ,
Calculation:
Interpretation: 45% of the variation in Exam 2 scores is accounted for by the model.
Visualizing with Scatterplots
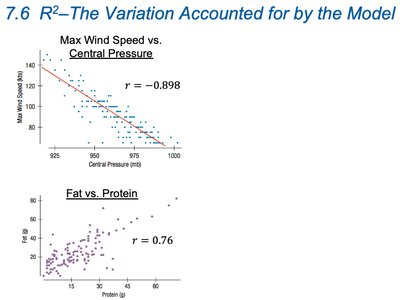
Scatterplots help visualize the strength of association and the fit of the regression line.
Examples: Max Wind Speed vs. Central Pressure (), Fat vs. Protein ()
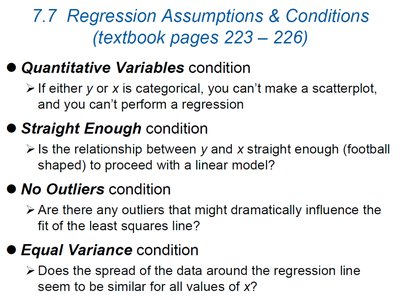
7.7 Regression Assumptions & Conditions
Key Conditions for Linear Regression
Before fitting a linear regression model, several assumptions must be checked to ensure the validity of the results:
Quantitative Variables: Both and must be quantitative. Regression is not appropriate for categorical variables.
Straight Enough: The relationship between and should be approximately linear (not curved or football-shaped).
No Outliers: Outliers can disproportionately affect the regression line and should be investigated.
Equal Variance (Homoscedasticity): The spread of residuals should be roughly constant for all values of .
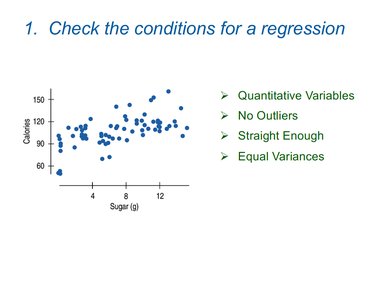
Checking Regression Conditions: Example
Scatterplot of Calories vs. Sugar in breakfast cereals is used to check conditions.
Checklist: Quantitative Variables, No Outliers, Straight Enough, Equal Variances
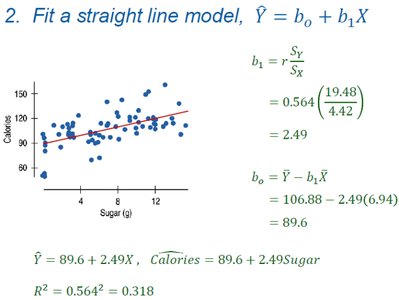
Fitting the Regression Model
Regression equation:
Slope:
Intercept:
Example: Calories = Sugar
(31.8% of the variation in Calories is explained by Sugar)
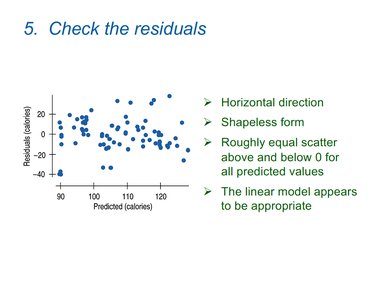
Checking the Residuals
Residuals should be randomly scattered around zero with no clear pattern.
Horizontal direction and shapeless form indicate a good fit.
Example: Residual plot for Calories vs. Sugar shows appropriate linear model.
Equal Variance Condition: Example
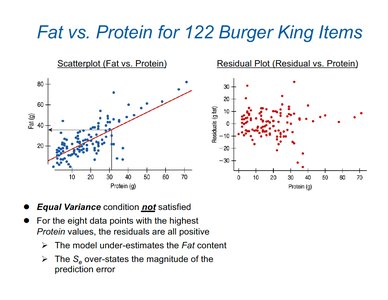
Fat vs. Protein for Burger King items: Residual plot shows violation of equal variance condition for high Protein values.
Model underestimates Fat content for high Protein values; overstates prediction error magnitude.
What Can Go Wrong in Regression
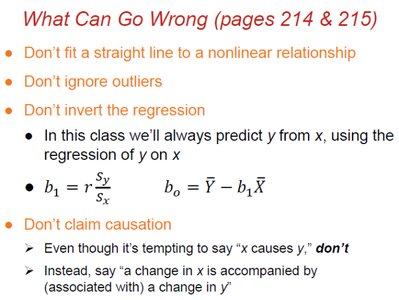
Nonlinear Relationships: Do not fit a straight line to a nonlinear relationship.
Outliers: Do not ignore outliers; they can distort the regression.
Regression Direction: Always predict from (not the other way around).
Causation: Do not claim causation from correlation; say "a change in is associated with a change in ."
8.2 Extrapolation: Reaching Beyond the Data
Understanding Extrapolation
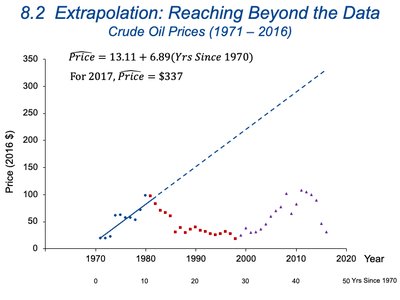
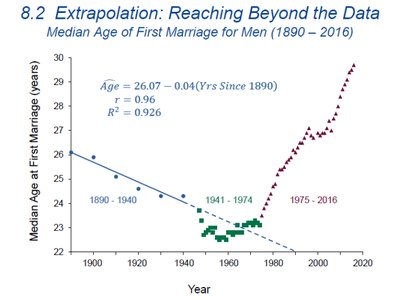
Extrapolation involves using a regression model to predict values outside the range of the observed data. This practice is risky because it assumes that the established relationship continues unchanged beyond the data.
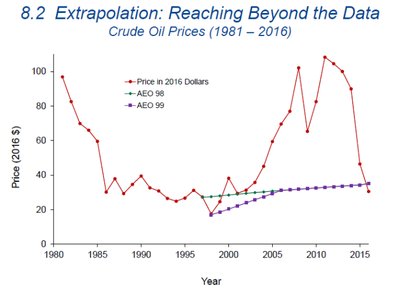
Example: Predicting crude oil prices or median age at first marriage far into the future can lead to unrealistic results.
Key Point: Past trends may not continue; extrapolation can be misleading.
What Can Go Wrong with Extrapolation
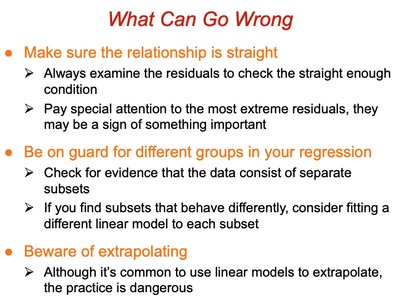
Straight Enough: Always check residuals for linearity; extreme residuals may indicate problems.
Different Groups: If data contain distinct groups, fit separate models as needed.
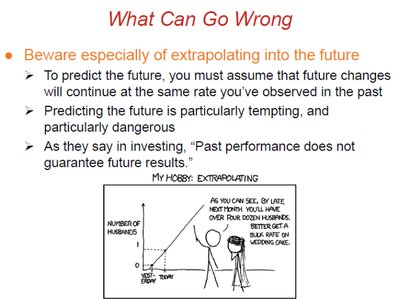
Extrapolation Dangers: Extrapolating can produce unreliable and unrealistic predictions.
Future Predictions: Predicting the future assumes trends continue, which is often not the case. "Past performance does not guarantee future results."
Summary Table: Regression Assumptions and Pitfalls
Assumption/Practice | Explanation |
|---|---|
Quantitative Variables | Both variables must be quantitative for regression to be valid. |
Straight Enough | Relationship should be linear; check with scatterplot and residuals. |
No Outliers | Outliers can distort regression; investigate and address them. |
Equal Variance | Residuals should have constant spread across all values of . |
Extrapolation | Predictions outside data range are risky and often unreliable. |
Reporting | Always report to indicate model fit. |
Correlation vs. Causation | Association does not imply causation; avoid causal claims. |
