 Indietro
Review of Confidence Intervals and Basic Statistical Inference
Guida di studio - Note intelligenti
 Appunti personalizzati basati sui tuoi materiali, ampliati con definizioni chiave, esempi e contesto.
Review of Basic Statistics
Why Learn Statistics?
Statistics is the discipline that transforms raw information into meaningful insights, enabling informed decision-making and action. It is foundational for understanding data in various fields, from science to business.
Descriptive Statistics: Summarizes and describes the main features of a dataset.
Graphical Summaries: Common visualizations include pie charts, bar graphs, histograms, and scatterplots.
Numerical Summaries: Key measures include:
Measures of Central Tendency: Mean, median, and mode.
Measures of Dispersion: Range, variance, and standard deviation.
Statistical Inference
Introduction to Statistical Inference
Statistical inference involves using sample data (statistics) to make conclusions about a larger population (parameters). This process is essential for making predictions and testing hypotheses.
Population: The entire group of interest.
Sample: A subset of the population used for analysis.
Parameter: A numerical summary of a population.
Statistic/Estimate: A numerical summary of a sample.
Sampling Designs: Includes simple random sampling and stratified random sampling.
Observational Studies vs. Randomized Controlled Experiments: Observational studies observe without intervention, while experiments assign treatments to study effects.
Association is not causation: Correlation does not imply a causal relationship.
Treatment Group vs. Control Group: Used in experiments to compare outcomes.
Sampling Distributions & Confidence Intervals
Distribution of Sample Proportion
For a simple random sample of size n with population proportion p, the sampling distribution of the sample proportion \( \hat{p} \) is approximately normal if certain conditions are met.
Shape: Approximately normal if \( np(1-p) \geq 10 \).
Mean: \( \mu_{\hat{p}} = p \)
Standard Deviation: \( \sigma_{\hat{p}} = \sqrt{\frac{p(1-p)}{n}} \)
Distribution of Sample Mean
The sampling distribution of the sample mean \( \bar{x} \) depends on the population distribution and sample size.
If the population is normal: The sample mean is normally distributed for any sample size.
If the population is not normal: The sample mean becomes approximately normal as the sample size increases (Central Limit Theorem).
Mean: \( \mu_{\bar{x}} = \mu \)
Standard Deviation: \( \sigma_{\bar{x}} = \frac{\sigma}{\sqrt{n}} \)
Point Estimates and Confidence Intervals
Key Concepts
Point Estimate: A single value estimate of a population parameter (e.g., sample mean \( \bar{x} \)).
Confidence Interval (CI): A range of values, derived from the sample, that is likely to contain the population parameter.
Level of Confidence: The probability that the CI contains the true parameter (commonly 95%).
Margin of Error: The maximum expected difference between the true parameter and a sample estimate.
Critical Value: The value from the standard normal (z) or t-distribution corresponding to the desired confidence level.
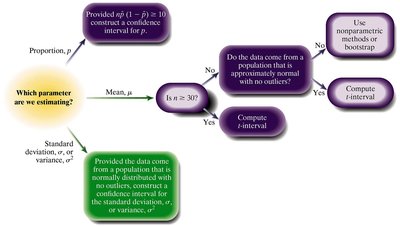
Choosing the Appropriate Confidence Interval
The type of confidence interval depends on the variable of interest and the data type.
Population Proportion: Use when data are qualitative with two possible outcomes (e.g., Yes/No).
Population Mean: Use when data are quantitative and summarized by mean and standard deviation.
Conditions for Constructing Confidence Intervals
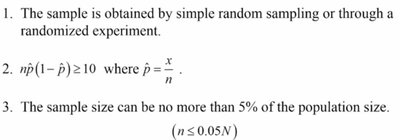
For a Population Proportion
The sample is obtained by simple random sampling or a randomized experiment.
\( np(1-\hat{p}) \geq 10 \), where \( \hat{p} = \frac{x}{n} \).
The sample size is no more than 5% of the population size (\( n \leq 0.05N \)).
For a Population Mean
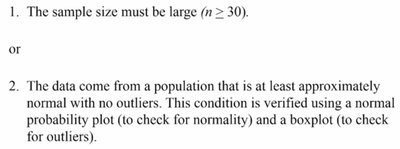
The sample must be obtained by simple random sampling or a randomized experiment, and \( n \leq 0.05N \).
Either:
The sample size is large (\( n \geq 30 \)), or
The data come from a population that is at least approximately normal with no outliers (verified using a normal probability plot and a boxplot).
Formulas for Confidence Intervals
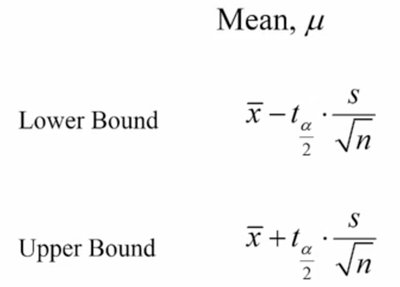
For a Population Mean (\( \mu \))
Lower Bound:
Upper Bound:
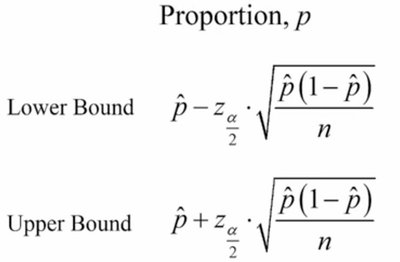
For a Population Proportion (\( p \))
Lower Bound:
Upper Bound:
Examples and Applications
Example: Constructing a Confidence Interval for a Mean
Suppose Robert wishes to estimate the mean number of miles his car can be driven on a full tank of gas. He collects a random sample of 10 measurements:
Sample mean (\( \bar{x} \)): 380.67
Sample standard deviation (s): 42.47
Sample size (n): 10
To construct a 95% confidence interval, verify normality and absence of outliers using a boxplot and a normal probability plot.
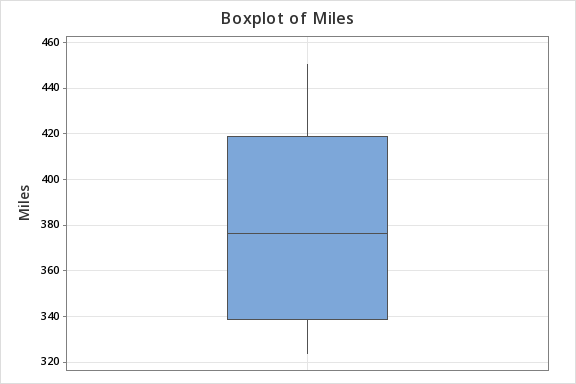
The boxplot shows no outliers, supporting the assumption of normality.
Using the t-distribution with 9 degrees of freedom (n-1), the critical value \( t_{0.025} = 2.262 \).
Lower Bound:
Upper Bound:
Interpretation: We are 95% confident that the population mean miles driven on a full tank of gas is between 350.29 and 411.05.

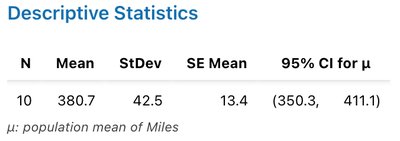
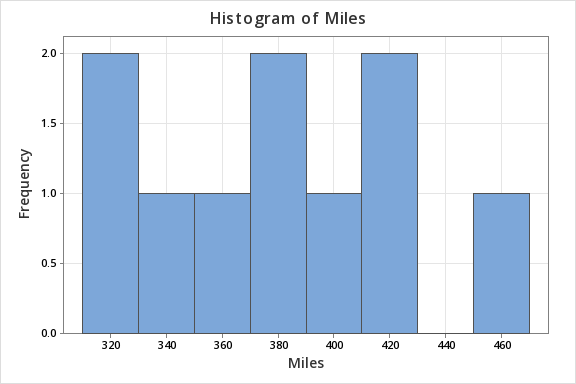
Summary Table: Descriptive Statistics for Miles Driven
Variable | N | Mean | SE Mean | StDev | Minimum | Q1 | Median | Q3 | Maximum |
|---|---|---|---|---|---|---|---|---|---|
Miles | 10 | 380.67 | 13.43 | 42.47 | 323.9 | 339.025 | 376.65 | 419.075 | 450.7 |
Practice: Identifying the Appropriate Confidence Interval
Quantitative variable (e.g., time spent studying): Use a confidence interval for the mean.
Qualitative variable with two outcomes (e.g., Yes/No): Use a confidence interval for the proportion.
Additional info: The examples provided reinforce the importance of matching the confidence interval method to the type of variable and data collected.
