 Indietro
Sampling Distribution Models and Confidence Intervals for Proportions
Guida di studio - Note intelligenti
 Appunti personalizzati basati sui tuoi materiali, ampliati con definizioni chiave, esempi e contesto.
Sampling Distribution Models and Confidence Intervals for Proportions
Certainty vs. Precision in Confidence Intervals
When constructing confidence intervals for population proportions, there is a fundamental trade-off between certainty and precision. A very wide interval (e.g., 0% to 100%) offers high certainty but little practical value, while a very narrow interval provides high precision but low certainty. The goal is to balance these two aspects to make meaningful statistical statements.
Certainty: The probability that the interval contains the true population proportion.
Precision: The width of the interval; narrower intervals are more precise.
Trade-off: Increasing certainty (confidence level) widens the interval, decreasing precision.
Example: A weather forecast stating the temperature will be between 40 below zero and 200 above is certain but not precise.

Structure of a Confidence Interval for Proportions
A confidence interval for a population proportion is constructed using the sample proportion, a critical value from the Normal distribution, and the standard error. The margin of error (ME) quantifies the uncertainty in the estimate.
General Form: Estimate ± Margin of Error (ME)
Margin of Error Formula:
z*: Critical value for desired confidence level (e.g., 1.96 for 95%, 1.645 for 90%)
Increasing confidence level: Increases z* and ME, making the interval wider.
Decreasing confidence level: Decreases z* and ME, making the interval narrower.
Calculating Margin of Error: Examples
Margin of error can be calculated using the sample proportion or conservatively with p = 0.5 if the proportion is unknown.
Example 1: For a sample of 1520 adults, 52% responded "Never" to reading newspapers. For a 90% confidence interval:
Margin of error is about 2.1%.
Example 2 (Conservative): For the same sample, maximum ME for 95% confidence:
Margin of error is about 2.51%.
Interpreting Confidence Intervals
Confidence intervals are often misunderstood. The correct interpretation is that we are confident the interval contains the true population proportion, not the sample proportion.
Correct: "We are 99% confident that the population proportion is contained in our interval."
Incorrect: "There is a 99% chance the sample proportion is in our interval."
Interval Width: A 99% confidence interval is wider than a 95% confidence interval.
Example: Confidence Interval for a Proportion
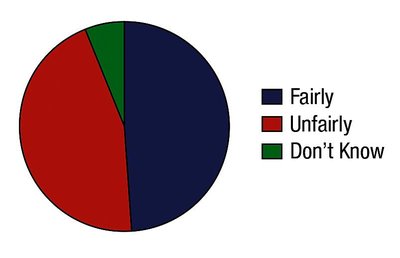
Suppose 1015 adults are surveyed about the fairness of the death penalty. 49% say "Fairly," 45% "Unfairly," and 6% "Don't Know." To find the margin of error and confidence interval for the proportion who think it is applied unfairly:
Sample size: n = 1015
Sample proportion:
For 90% confidence:
Standard error:
Margin of error:
Reducing Margin of Error
To reduce the margin of error without lowering the confidence level, increase the sample size. Lowering the critical value (z*) also reduces ME but decreases confidence.
Increase sample size: Reduces ME while maintaining confidence.
Decrease z*: Reduces ME but lowers confidence.
Decrease sample size: Increases ME.
Conditions for Using the Normal Model
Before constructing a confidence interval for a proportion, certain conditions must be met to justify the use of the Normal model:
Randomization Assumption: The sample must be random and respondents independent.
10% Condition: The sample size should be less than 10% of the population.
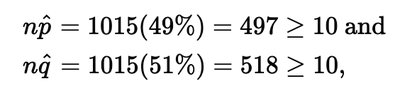
Success/Failure Condition: Both and must be at least 10.
Constructing a Confidence Interval: Step-by-Step Example
For the survey on the fairness of the death penalty:
Sample size: n = 1015
Sample proportion: ("Fairly")
Standard error:
Margin of error:
Confidence interval: or
Conclusion: We are 95% confident that the proportion of all U.S. adults who think the death penalty is applied fairly is between 0.459 and 0.521.
Summary Table: Confidence Interval Components
Component | Description |
|---|---|
Sample Proportion () | Observed proportion in sample |
Critical Value () | Depends on confidence level (e.g., 1.96 for 95%) |
Standard Error () | |
Margin of Error (ME) | |
Confidence Interval |
