 Indietro
Statistics Final Exam Study Notes: Probability, Random Variables, and Regression
Guida di studio - Note intelligenti
 Appunti personalizzati basati sui tuoi materiali, ampliati con definizioni chiave, esempi e contesto.
Probability Rules and Concepts
Basic Probability Rules
Probability is the mathematical study of randomness and uncertainty. The following rules are fundamental for calculating probabilities in various scenarios:
Total Probability Rule: The probability of the sample space S is always 1.
Complement Rule: The probability of an event A is 1 minus the probability of its complement.
Addition Rule for Disjoint Events: If A and B are mutually exclusive,
General Addition Rule: For any two events,
Conditional Probability: The probability of B given A is
General Multiplication Rule:
Multiplication Rule for Independent Events: If A and B are independent,
Random Variables and Their Properties
Expected Value and Variance
A random variable is a numerical outcome of a random process. The expected value (mean), variance, and standard deviation are key characteristics:
Expected Value (Mean):
Variance:
Standard Deviation:
Combining Random Variables
Adding/Subtracting Constants: Adding a constant to a random variable shifts the mean but does not affect the variance or standard deviation.
Multiplying by Constants: Multiplying a random variable by a constant a multiplies the mean by a and the standard deviation by |a|:
If X and Y are independent:
Binomial Model
Binomial Probability
The binomial model describes the probability of k successes in n independent trials, each with probability p of success:
Binomial Coefficient:
Probability of k successes: , where
Mean (Expected Number of Successes):
Standard Deviation:
n = number of trials, k = number of successes, p = probability of success, q = probability of failure.
Correlation and Regression
Correlation Coefficient
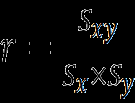
The correlation coefficient (r) measures the strength and direction of a linear relationship between two quantitative variables:
Formula:
Where is the covariance, and are the standard deviations of X and Y, respectively.
Regression Analysis
Regression is used to model the relationship between a dependent variable Y and an independent variable X.
Residual:
Line of Best Fit:
Slope:
Intercept:
Regression to the Mean: The predicted value is closer to the mean of Y than X is to the mean of X, unless r = ±1.
Residual Standard Deviation: Measures the typical size of the residuals (errors) from the regression line.
The Normal Model and Z-Scores
Standard Deviation as a Ruler and the Normal Model
The normal model is a symmetric, bell-shaped distribution characterized by its mean (μ) and standard deviation (σ). Z-scores standardize values for comparison:
Z-Score:
Z-scores indicate how many standard deviations a value is from the mean.
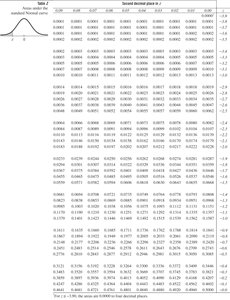
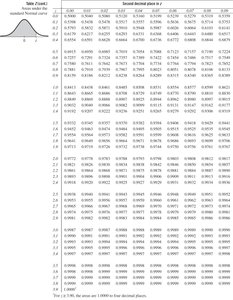
Normal tables (Z-tables) are used to find probabilities and percentiles for standard normal distributions.
Using the Standard Normal Table
The standard normal table provides the area (probability) to the left of a given z-score in the standard normal distribution. To use the table:
Find the row for the first two digits of the z-score.
Find the column for the second decimal place.
The intersection gives the cumulative probability.
For negative z-scores, use the left table; for positive z-scores, use the right table.
Summary Table: Key Formulas and Concepts
Concept | Formula | Description |
|---|---|---|
Expected Value | Mean of a random variable | |
Variance | Spread of a random variable | |
Standard Deviation | Typical deviation from the mean | |
Binomial Probability | Probability of k successes in n trials | |
Correlation Coefficient | Strength of linear relationship | |
Regression Line | Best fit line for prediction | |
Z-Score | Standardized value |
