 Indietro
Statistics Test 1 Review: Descriptive Statistics, Probability, and Distributions
Guida di studio - Note intelligenti
 Appunti personalizzati basati sui tuoi materiali, ampliati con definizioni chiave, esempi e contesto.
Descriptive Statistics
Variables and Individuals
Descriptive statistics involve summarizing and organizing data to understand its main features. The two fundamental concepts are variables and individuals.
Individual: The entity being measured or observed (e.g., a batch of pizza dough, a city, a person).
Variable: A characteristic or property measured on individuals. Variables can be:
Qualitative (Categorical): No numeric value or intrinsic order (e.g., recipe type).
Quantitative (Numeric): Numeric values, which can be:
Discrete: Countable values, often integers (e.g., number of color blind men).
Continuous: Any value within a range (e.g., calcium concentration in water).
Types of Graphs for Data Visualization
Graphs are essential for visualizing data distributions and relationships. The choice of graph depends on the variable type.
Frequency Distribution: Shows counts for each category or value.
Relative Frequency Distribution: Shows proportions for each category or value.
Pie Chart: Visualizes proportions of categorical data.
Bar Graph: Compares frequencies or proportions for categorical data.
Histogram: Displays frequency of numeric data grouped into intervals.
Dotplot: Shows individual data points for small datasets.
Stemplot: Splits data into stems and leaves for quick visualization.
Boxplot: Summarizes distribution using quartiles and highlights outliers.
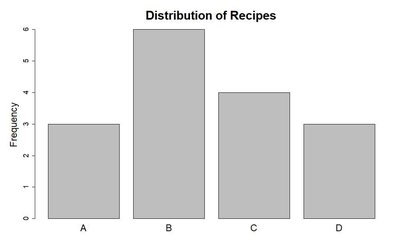
Example: Distribution of Recipes (Bar Graph)
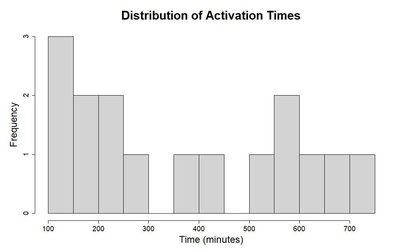
Example: Distribution of Activation Times (Histogram)
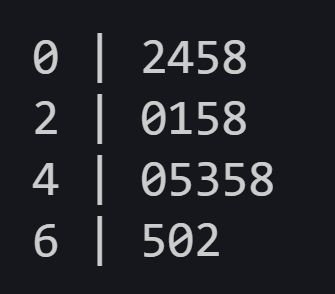
Example: Stemplot of Activation Times
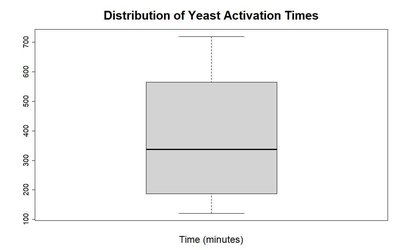
Example: Boxplot of Yeast Activation Times
Describing Distributions
To describe a distribution, consider:
Center: Mean, median, mode
Spread: Range, interquartile range (IQR), standard deviation (SD)
Shape: Symmetry, skewness, modality (number of peaks), outliers
Example: Water Hardness (Calcium Concentration)
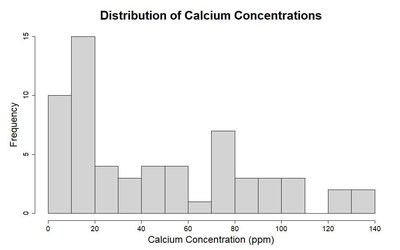
Individuals: Cities
Variable: Calcium concentration (continuous, numeric)
Distribution: Skewed right, possible outliers, unimodal
Probability Foundations
Basic Definitions
Sample Space (S): All possible outcomes of a random experiment.
Event: Any subset of the sample space.
Probability Model: Assigns probabilities to outcomes/events.
Probability Definitions
Symmetry Definition: If all outcomes are equally likely,
Frequentist Definition: Probability is the long-run proportion of times an event occurs in repeated trials.
Probability Rules
Addition Rule (Special): For mutually exclusive events,
Addition Rule (General):
Complement Rule:
Venn Diagrams
Venn diagrams visually represent relationships between events in a sample space, aiding in understanding probability rules.
Independence and Conditional Probability
Independent Events:
Conditional Probability:
Contingency Tables
Contingency tables display frequencies for combinations of two categorical variables. Marginal totals are row/column sums; the grand total is the sum of all cells.
Age Group | Some H.S. | High School | Some Uni. | University | Total |
|---|---|---|---|---|---|
25-34 | 27 | 82 | 43 | 48 | 200 |
35-44 | 50 | 19 | 56 | 75 | 200 |
45-54 | 52 | 88 | 26 | 34 | 200 |
55-64 | 71 | 83 | 20 | 26 | 200 |
65+ | 101 | 59 | 20 | 20 | 200 |
Total | 301 | 331 | 165 | 203 | 1000 |
Counting Rules
Permutations: Number of ways to arrange n objects:
Combinations: Number of ways to choose r objects from n:
Discrete Random Variables
Discrete Distributions
Discrete random variables take on countable values. Their distributions specify the probability for each possible value.
Mean (Expected Value):
Standard Deviation:
Binomial Distribution
Models the number of successes in n independent trials, each with probability p of success.
Probability:
Mean:
Standard Deviation:
Poisson Distribution
Models the number of events in a fixed interval, given a known average rate.
Probability:
Mean and SD:
Continuous Random Variables
Probability Density Functions (PDFs)
Probability is the area under the density curve over an interval.
Probability of a single value is zero.
Mean and SD are defined similarly to discrete variables, using integrals.
Exponential Distribution
Models time between events in a Poisson process.
PDF: for
Mean:
SD:
Normal Distribution
Symmetric, bell-shaped distribution defined by mean and standard deviation .
PDF:
Probabilities are found using standard normal tables or functions (e.g., pnorm, qnorm).
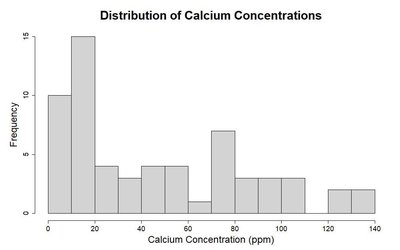
Example: Distribution of Calcium Concentrations (Histogram)
Empirical Rule
For normal distributions:
~68% of data within 1 SD of mean
~95% within 2 SD
~99.7% within 3 SD
Summary Table: Graph Types and Their Uses
Graph Type | Variable Type | Main Use |
|---|---|---|
Bar Graph | Categorical | Compare frequencies/proportions |
Pie Chart | Categorical | Show proportions |
Histogram | Numeric (Continuous/Discrete) | Show distribution shape |
Dotplot | Numeric (Small datasets) | Show individual values |
Stemplot | Numeric (Small datasets) | Quick visualization |
Boxplot | Numeric | Summarize spread, center, outliers |
Additional info: Some explanations and table entries were expanded for completeness and clarity based on standard statistics curriculum.
