 Indietro
Statistics Test 1 Review: Practice Questions and Step-by-Step Guidance
Guida di studio - Note intelligenti
 Appunti personalizzati basati sui tuoi materiali, ampliati con definizioni chiave, esempi e contesto.
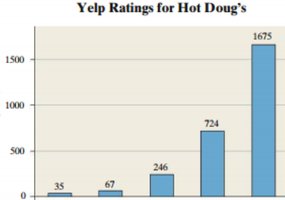
Q13. The following graph shows the ratings (1-5 stars) on Yelp for Hot Doug’s Restaurant. Label the x and y axis.
Background
Topic: Interpreting and Labeling Graphs (Frequency Distributions)
This question tests your ability to read and interpret bar graphs (or histograms) and to correctly label the axes based on the data being presented. Understanding how to label axes is essential for clear communication of statistical information.
Key Terms:
X-axis: The horizontal axis, typically representing the categories or groups being measured (in this case, the number of stars in the Yelp rating).
Y-axis: The vertical axis, typically representing the frequency or count of observations in each category (in this case, the number of ratings for each star level).
Step-by-Step Guidance
Look at the bars along the horizontal axis. Notice that each bar corresponds to a different number of stars (1, 2, 3, 4, 5).
Think about what the numbers along the vertical axis represent. Each bar rises to a certain height, and the numbers at the top of each bar (35, 67, 246, 724, 1675) indicate how many ratings were received for each star level.
Recall that the x-axis should be labeled with the variable being categorized (here, the number of stars in the Yelp rating), and the y-axis should be labeled with the frequency (here, the number of ratings).
Write appropriate labels for each axis, making sure they clearly describe what is being measured.
Try solving on your own before revealing the answer!
Final Answer:
X-axis label: Number of Stars (Yelp Rating)
Y-axis label: Number of Ratings (Frequency)
The x-axis should be labeled with the possible Yelp star ratings (1, 2, 3, 4, 5), and the y-axis should be labeled with the number of ratings (frequency) for each star level.
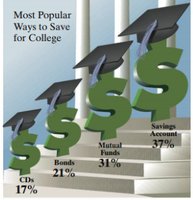
Q14. The following is a USA Today-type graph. Do you think the graph is misleading? Why? If you think it is misleading, what might be done to improve the graph?
Background
Topic: Interpreting and Critiquing Graphs (Graphical Misrepresentation)
This question tests your ability to critically evaluate the design of a graph and determine whether it accurately represents the data or could mislead viewers. Recognizing misleading graphs is an important skill in statistics and data literacy.
Key Terms:
Misleading graph: A graph that distorts the data visually, making differences appear larger or smaller than they really are.
Pictogram: A graph that uses pictures or symbols to represent data, which can sometimes exaggerate differences if the area or volume of the symbols is not proportional to the data values.
Step-by-Step Guidance
Examine the graph and note how the data is being represented. Notice the use of dollar signs of different sizes to represent the percentages for each savings method.
Consider whether the size of each symbol (dollar sign) is proportional to the percentage it represents, or if the visual effect exaggerates the differences between categories.
Think about how a viewer might interpret the graph. Does the use of larger symbols for higher percentages make the differences seem bigger than they are numerically?
Reflect on how the graph could be improved to more accurately represent the data, such as using a bar graph with proportional heights or clearly labeled axes.
Try solving on your own before revealing the answer!
Final Answer:
Yes, the graph is misleading. The size of the dollar signs increases in both height and width, so the area (and visual impact) grows much faster than the actual percentage differences. This exaggerates the differences between categories. To improve the graph, use a bar graph with bars proportional in height to the percentages, and include a clearly labeled axis to show the actual values.
