 Indietro
Study Notes: Data Collection, Sampling Methods, and Statistical Analysis in Introductory Statistics
Guida di studio - Note intelligenti
 Appunti personalizzati basati sui tuoi materiali, ampliati con definizioni chiave, esempi e contesto.
Data Collection in Statistics
Observational Studies and Experimental Design
Data collection is a foundational aspect of statistics, as it determines the quality and reliability of conclusions drawn from statistical analysis. In observational studies, researchers observe subjects without manipulating variables, while in experiments, researchers actively impose treatments to study effects.
Observational Study: Researchers observe and measure characteristics without influencing the subjects. Example: Tracking health outcomes in seniors who choose to get vaccinated versus those who do not.
Experimental Study: Researchers assign treatments to subjects and observe the effects. Example: Randomly assigning seniors to receive a vaccine or placebo and measuring outcomes.
Confounding Variables: Factors other than the treatment that may affect the outcome, making it difficult to determine causality.
Example: In the provided study, researchers observed two groups of seniors (those who chose to get the flu vaccine and those who did not) over 10 years to assess the long-term benefits of vaccination. This is an observational study because the assignment to groups was not randomized.
Sampling Methods
Types of Sampling Techniques
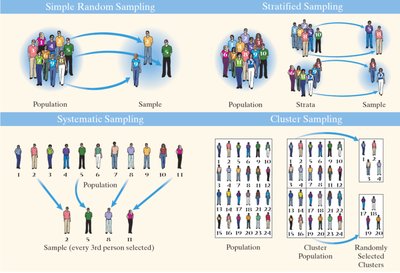
Sampling methods are strategies used to select a subset of individuals from a population to estimate characteristics of the whole population. Proper sampling is crucial for obtaining representative and unbiased results.
Simple Random Sampling: Every member of the population has an equal chance of being selected. This method reduces selection bias and is the gold standard for representativeness.
Stratified Sampling: The population is divided into subgroups (strata) based on a characteristic, and random samples are taken from each stratum. This ensures representation from all key subgroups.
Systematic Sampling: Every nth member of the population is selected after a random starting point. This method is easy to implement but can introduce bias if there is a pattern in the population.
Cluster Sampling: The population is divided into clusters, some clusters are randomly selected, and all members of chosen clusters are sampled. Useful for large, geographically dispersed populations.
Example: To study vaccination rates, researchers might use stratified sampling to ensure both age and gender groups are proportionally represented.
Summarizing Data: The Empirical Rule and Normal Distribution
The Empirical Rule
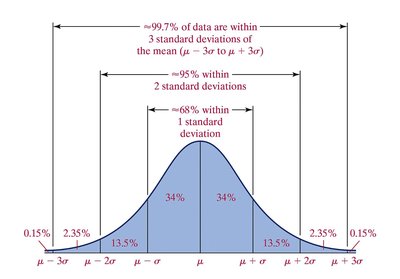
The Empirical Rule describes how data are distributed in a normal (bell-shaped) distribution. It provides a quick way to estimate the spread of data around the mean using standard deviations.
About 68% of data falls within 1 standard deviation of the mean ( to ).
About 95% of data falls within 2 standard deviations of the mean ( to ).
About 99.7% of data falls within 3 standard deviations of the mean ( to ).
Formula:
= mean of the distribution
= standard deviation
Example: If the average age of seniors in a study is 70 years with a standard deviation of 5 years, about 68% of seniors are between 65 and 75 years old.
Describing the Relationship Between Two Variables
Regression and Deviation Analysis
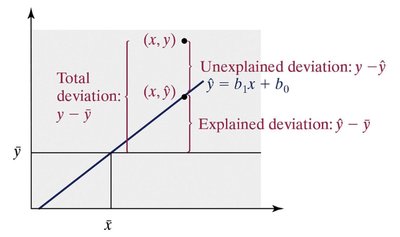
Regression analysis is used to describe the relationship between two quantitative variables. The least-squares regression line is the line that minimizes the sum of squared differences between observed and predicted values.
Total Deviation: The difference between the observed value () and the mean of ().
Explained Deviation: The difference between the predicted value () and the mean of ().
Unexplained Deviation: The difference between the observed value and the predicted value ().
Regression Equation:
Example: In studying the effect of vaccination on hospitalization rates, regression can help quantify how vaccination status (independent variable) predicts hospitalization risk (dependent variable).
Application: Interpreting Statistical Results
Understanding Study Outcomes
Statistical analysis allows researchers to draw conclusions about populations based on sample data. In the influenza vaccine study:
Seniors who received the flu shot were 27% less likely to be hospitalized for pneumonia or influenza.
Seniors who received the flu shot were 48% less likely to die from pneumonia or influenza.
These results suggest a strong association between vaccination and improved health outcomes, though causality cannot be definitively established without a randomized experiment.
Additional info: In observational studies, results may be influenced by confounding variables, such as overall health status or access to healthcare, which should be considered when interpreting findings.
