Ch. 12 - Analysis of Variance
Triola - Elementary Statistics 14th Edition
Triola14th EditionElementary StatisticsISBN: 9780137366446Non è quello che usi tu?Cambia libro di testo
Capitolo 12, Problema 12.CRE.1e

In Exercises 1–5, refer to the following list of numbers of years that deceased U.S. presidents, popes, and British monarchs lived after their inauguration, election, or coronation, respectively. (As of this writing, the last president is George H. W. Bush, the last pope is John Paul II, and the last British monarch is George VI.) Assume that the data are samples from larger populations.


[Image]


Exploring the Data Include appropriate units in all answers.


e. What is the level of measurement of the data (nominal, ordinal, interval, ratio)?

Guida verificata passo dopo passo
1
Step 1: Understand the levels of measurement. There are four levels of measurement in statistics: nominal, ordinal, interval, and ratio. Each level provides different types of information about the data.
Step 2: Analyze the data provided. The data represents the number of years that deceased U.S. presidents, popes, and British monarchs lived after their inauguration, election, or coronation. These are numerical values.
Step 3: Determine if the data has a true zero point. Since the data represents the number of years lived after a specific event, it has a meaningful zero point (e.g., 0 years lived after the event). This indicates that the data is at least at the ratio level.
Step 4: Check if the data allows for meaningful ratios. For example, if one individual lived 20 years after their inauguration and another lived 10 years, the ratio (20/10 = 2) is meaningful. This confirms that the data is at the ratio level.
Step 5: Conclude that the level of measurement for this data is 'ratio,' as it is numerical, has a true zero point, and allows for meaningful ratios.

Risposta video verificata per un problema simile:

Questa soluzione video è stata consigliata dai nostri tutor come utile per risolvere questo problema.
Durata del video:
2m

Concetti chiave

Ecco i concetti essenziali che devi comprendere per rispondere correttamente alla domanda.

Levels of Measurement

Levels of measurement refer to the different ways data can be categorized and analyzed. There are four primary levels: nominal, ordinal, interval, and ratio. Nominal data are categories without a specific order, ordinal data have a defined order but no consistent difference between values, interval data have meaningful differences but no true zero point, and ratio data have both meaningful differences and a true zero, allowing for the comparison of absolute magnitudes.
Video consigliato:
Percorso guidato
10:28
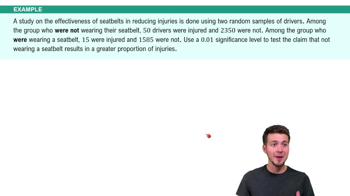
Difference in Proportions: Hypothesis Tests Example 1

Nominal Data

Nominal data is the simplest level of measurement, consisting of categories that cannot be ordered or ranked. Examples include gender, race, or types of fruit. In the context of the question, nominal data would not apply since the years lived can be ordered and compared, indicating a higher level of measurement.
Video consigliato:
Percorso guidato
04:39
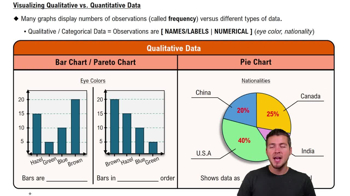
Visualizing Qualitative vs. Quantitative Data

Ratio Data

Ratio data is a quantitative measurement that has all the properties of interval data, with the addition of a true zero point. This means that not only can you measure differences between values, but you can also make meaningful statements about how many times greater one value is compared to another. In the context of the years lived by presidents, popes, and monarchs, this data is ratio because it allows for comparisons and has a true zero (e.g., living 0 years after inauguration).
Video consigliato:
Percorso guidato
04:39
Visualizing Qualitative vs. Quantitative Data
Pratica correlata
Domanda del libro di testo

Quarters Assume that weights of quarters minted after 1964 are normally distributed with a mean of 5.670 g and a standard deviation of 0.062 g (based on U.S. Mint specifications).

b. If 25 quarters are randomly selected, find the probability that their mean weight is greater than 5.675 g.

104
views
Domanda del libro di testo

Pulse Rates Shown below are pulse rates from Data Set 1 “Body Data” in Appendix B, and the StatCrunch display from two-way analysis of variance of these data. In analyzing these data, what important feature is addressed with two-way analysis of variance that is not addressed with two separate tests of (1) difference between mean pulse rates based on gender, or (2) differences among the mean pulse rates in the different age brackets?

53
views
Domanda del libro di testo

Win 4 Lottery Shown below is a histogram of digits selected in California’s Win 4 lottery. Each drawing involves the random selection (with replacement) of four digits between 0 and 9 inclusive.


c. Identify the frequencies, then test the claim that the digits are selected from a population in which the digits are all equally likely. Is there a problem with the lottery?


140
views
Domanda del libro di testo

One vs. Two What is the fundamental difference between one-way analysis of variance and two-way analysis of variance?

104
views
Domanda del libro di testo

Interaction

b. If there does appear to be an interaction between gender and age bracket, how should we continue with the procedure for two-way analysis of variance?

59
views
Domanda del libro di testo

Win 4 Lottery Shown below is a histogram of digits selected in California’s Win 4 lottery. Each drawing involves the random selection (with replacement) of four digits between 0 and 9 inclusive.


b. Does the display depict a normal distribution? Why or why not? What should be the shape of the histogram?


141
views