Ch. 12 - Analysis of Variance
Triola - Elementary Statistics 14th Edition
Triola14th EditionElementary StatisticsISBN: 9780137366446Non è quello che usi tu?Cambia libro di testo
Capitolo 12, Problema 12.Q.7

One vs. Two What is the fundamental difference between one-way analysis of variance and two-way analysis of variance?

Guida verificata passo dopo passo
1
Understand that both one-way and two-way ANOVA are statistical methods used to compare means across groups to see if there are significant differences.
Recognize that one-way ANOVA involves only one independent categorical variable (factor) with two or more levels or groups, and it tests whether the means across these groups differ.
Know that two-way ANOVA involves two independent categorical variables (factors), each with two or more levels, and it tests for the main effects of each factor as well as any interaction effect between the two factors.
Recall that the interaction effect in two-way ANOVA examines whether the effect of one factor depends on the level of the other factor, which is not possible to assess in one-way ANOVA.
Summarize that the fundamental difference lies in the number of factors analyzed: one-way ANOVA analyzes one factor, while two-way ANOVA analyzes two factors and their interaction.

Risposta video verificata per un problema simile:

Questa soluzione video è stata consigliata dai nostri tutor come utile per risolvere questo problema.
Durata del video:
1m

Concetti chiave

Ecco i concetti essenziali che devi comprendere per rispondere correttamente alla domanda.

One-Way Analysis of Variance (ANOVA)

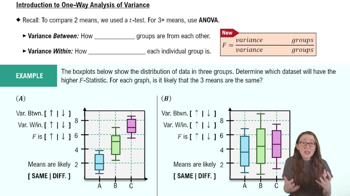
One-way ANOVA is a statistical method used to compare the means of three or more groups based on a single independent factor. It tests whether there are any statistically significant differences among group means by analyzing variance within and between groups.
Video consigliato:
Percorso guidato
06:46
Introduction to ANOVA

Two-Way Analysis of Variance (ANOVA)

Two-way ANOVA extends one-way ANOVA by examining the effect of two independent factors simultaneously on a dependent variable. It also evaluates the interaction effect between the two factors, showing how the combination of factors influences the outcome.
Video consigliato:
Percorso guidato
06:46
Introduction to ANOVA

Interaction Effect in Two-Way ANOVA

The interaction effect occurs when the impact of one independent factor on the dependent variable depends on the level of the other factor. Identifying interaction helps understand if factors work independently or jointly affect the response variable.
Video consigliato:
Percorso guidato
02:43
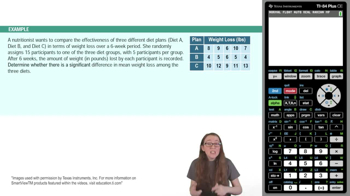
ANOVA Test Using TI-84 Example 1
Pratica correlata
Domanda del libro di testo

Pulse Rates Shown below are pulse rates from Data Set 1 “Body Data” in Appendix B, and the StatCrunch display from two-way analysis of variance of these data. In analyzing these data, what important feature is addressed with two-way analysis of variance that is not addressed with two separate tests of (1) difference between mean pulse rates based on gender, or (2) differences among the mean pulse rates in the different age brackets?

53
views
Domanda del libro di testo

Win 4 Lottery Shown below is a histogram of digits selected in California’s Win 4 lottery. Each drawing involves the random selection (with replacement) of four digits between 0 and 9 inclusive.


c. Identify the frequencies, then test the claim that the digits are selected from a population in which the digits are all equally likely. Is there a problem with the lottery?


140
views
Domanda del libro di testo

Interaction

b. If there does appear to be an interaction between gender and age bracket, how should we continue with the procedure for two-way analysis of variance?

59
views
Domanda del libro di testo

Win 4 Lottery Shown below is a histogram of digits selected in California’s Win 4 lottery. Each drawing involves the random selection (with replacement) of four digits between 0 and 9 inclusive.


b. Does the display depict a normal distribution? Why or why not? What should be the shape of the histogram?


141
views
Domanda del libro di testo

Gender and Age Bracket Based on the display included with Exercise 8, what are the final conclusions?

36
views
Domanda del libro di testo

In Exercises 1–5, refer to the following list of numbers of years that deceased U.S. presidents, popes, and British monarchs lived after their inauguration, election, or coronation, respectively. (As of this writing, the last president is George H. W. Bush, the last pope is John Paul II, and the last British monarch is George VI.) Assume that the data are samples from larger populations.


[Image]


Exploring the Data Include appropriate units in all answers.


e. What is the level of measurement of the data (nominal, ordinal, interval, ratio)?

131
views