 Indietro
Distance and Midpoint Formulas; Graphs, Intercepts, and Symmetry in the Coordinate Plane
Guida di studio - Note intelligenti
 Appunti personalizzati basati sui tuoi materiali, ampliati con definizioni chiave, esempi e contesto.
2.1 The Distance and Midpoint Formulas
The Coordinate Plane
The coordinate plane consists of two perpendicular number lines: the x-axis (horizontal) and the y-axis (vertical). Their intersection point is called the origin, denoted as (0, 0). Any point in the plane is represented by an ordered pair (x, y), where x is the horizontal coordinate and y is the vertical coordinate.
Quadrants: The plane is divided into four quadrants:
Quadrant I: (+, +) — both x and y are positive (e.g., (1, 2))
Quadrant II: (−, +) — x is negative, y is positive (e.g., (−3, 1))
Quadrant III: (−, −) — both x and y are negative (e.g., (−4, −1))
Quadrant IV: (+, −) — x is positive, y is negative (e.g., (3, −2))
Pythagorean Theorem Refresher
The Pythagorean Theorem states that in a right triangle, the square of the hypotenuse equals the sum of the squares of the other two sides:
Distance Formula
The distance between two points and in the plane is given by:
Example: Find the distance between and .
Midpoint Formula
The midpoint of the segment joining and is:
Example: Find the midpoint between and .
2.2 Graphs of Equations in Two Variables; Intercepts; Symmetry
Equations in Two Variables
An equation in two variables (x and y) is a statement where two expressions involving x and y are equal. The graph of such an equation is the set of all points (x, y) that satisfy the equation.
Example: Does (2, 3) satisfy ? Substitute: (True).
Graphing Equations
Make a table of x-values (inputs) and compute corresponding y-values (outputs).
Plot the resulting (x, y) points on the coordinate plane.
Intercepts
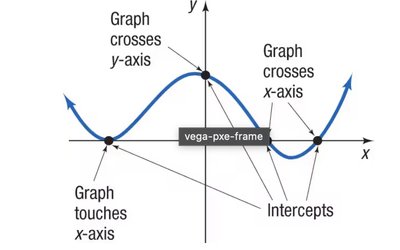
Intercepts are points where a graph crosses or touches the axes.
x-intercept: Set y = 0 and solve for x.
y-intercept: Set x = 0 and solve for y.
There can be multiple x-intercepts but only one y-intercept for a function.
Example: For :
x-intercepts:
y-intercept:
Intercepts: (3, 0), (−1, 0), (0, −3)
Symmetry of Graphs
A graph may be symmetric with respect to the x-axis, y-axis, or the origin:
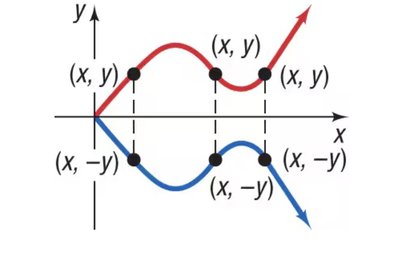
x-axis symmetry: For every (x, y), (x, −y) is also on the graph.
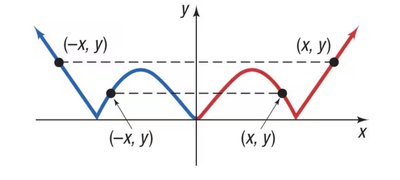
y-axis symmetry: For every (x, y), (−x, y) is also on the graph.
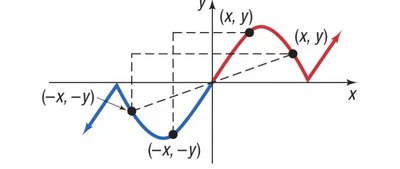
Origin symmetry: For every (x, y), (−x, −y) is also on the graph.
Visualizing Symmetry
x-axis symmetry: Reflects across the x-axis.
y-axis symmetry: Reflects across the y-axis.
Origin symmetry: Rotational symmetry about the origin (180°).
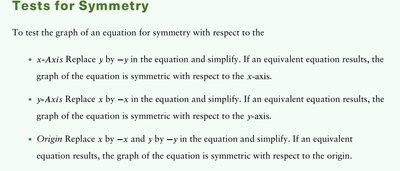
Testing for Symmetry
Type of Symmetry | Test |
|---|---|
x-axis | Replace y with −y in the equation. If the equation is unchanged, the graph is symmetric about the x-axis. |
y-axis | Replace x with −x in the equation. If the equation is unchanged, the graph is symmetric about the y-axis. |
Origin | Replace x with −x and y with −y. If the equation is unchanged, the graph is symmetric about the origin. |
Example: Test for symmetry:
x-axis: Replace y with −y (no y present, so symmetry holds).
y-axis: Replace x with −x: (symmetry holds).
Origin: Replace x with −x and y with −y: (symmetry holds).
Additional info: Symmetry helps in sketching graphs efficiently and understanding the nature of equations.
