 Indietro
Limits and Continuity: Foundations for Calculus
Guida di studio - Note intelligenti
 Appunti personalizzati basati sui tuoi materiali, ampliati con definizioni chiave, esempi e contesto.
Secant and Tangent Lines; The Idea of Limits
Secant and Tangent Lines
Secant and tangent lines are fundamental concepts for understanding the behavior of functions and the concept of limits.
Secant Line: A line passing through two distinct points on the graph of a function f.
Tangent Line: A line that touches the graph of f at exactly one point (x = a), representing the instantaneous rate of change at that point.
Slope of Secant Line:
Slope of Tangent Line:
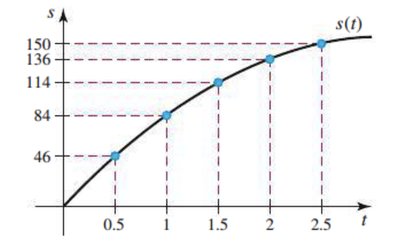
Example (Velocity): If s(t) is the position of an object at time t:
Average Velocity:
Instantaneous Velocity:
Definitions and Properties of Limits
Limit of a Function
The limit of a function describes the value that f(x) approaches as x approaches a specific value a. It is written as .
The limit depends on the values of f(x) near x = a, not necessarily at x = a.
Limits can be evaluated graphically, numerically (using tables), or algebraically.
One-Sided Limits
Right-sided limit: (as x approaches a from the right)
Left-sided limit: (as x approaches a from the left)
If the left- and right-sided limits are not equal, the two-sided limit does not exist (DNE).
Techniques for Computing Limits
Limit Laws
Limits can be evaluated using algebraic properties:
Sum/Difference:
Product:
Quotient: (if denominator ≠ 0)
Power/Root:
Direct Substitution
For polynomials and rational functions (where denominator ≠ 0), substitute x = a directly.
If substitution yields (indeterminate form), use factoring, conjugates, or other algebraic techniques to simplify.
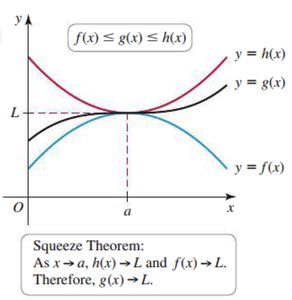
Squeeze Theorem
If near , and , then .
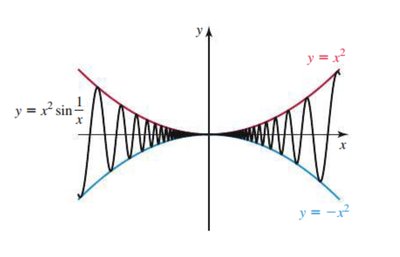
Oscillating Functions and the Squeeze Theorem
Some functions oscillate as x approaches a value. The Squeeze Theorem can be used to show that the limit exists even if the function itself oscillates.
Infinite Limits and Vertical Asymptotes
Infinite Limits
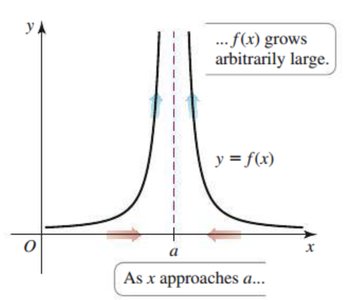
An infinite limit occurs when f(x) increases or decreases without bound as x approaches a value a:
means f(x) grows arbitrarily large.
means f(x) decreases without bound.
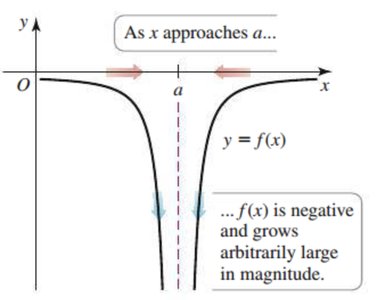
Vertical Asymptotes
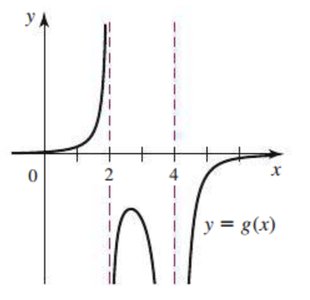
A vertical asymptote occurs at if approaches or as approaches from at least one side.
Graphical Identification of Infinite Limits
To evaluate infinite limits from a graph, observe the behavior of as approaches the value of interest from the left and right.
Limits at Infinity and Horizontal Asymptotes
Limits at Infinity
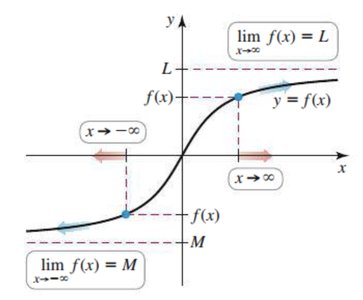
Limits at infinity describe the end behavior of a function as becomes very large (positive or negative):
means approaches as increases without bound.
means approaches as decreases without bound.
Horizontal asymptotes occur at and .
Continuity
Continuity at a Point
A function f is continuous at if:
is defined
exists
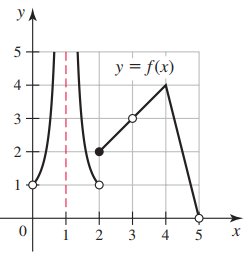
Types of Discontinuities
Removable discontinuity: A hole in the graph; the limit exists but is undefined or not equal to the limit.
Jump discontinuity: The left- and right-hand limits exist but are not equal.
Infinite discontinuity: The function increases or decreases without bound near the point (vertical asymptote).
Oscillating discontinuity: The function oscillates near the point without approaching a single value.
Continuity on Intervals
A function is continuous on an interval if it is continuous at every point in the interval. At endpoints, one-sided continuity is used.
Summary Table: Types of Asymptotes and Limits
Type | Definition | Equation | Graphical Feature |
|---|---|---|---|
Vertical Asymptote | Function grows without bound as x approaches a | x = a | Infinite limit |
Horizontal Asymptote | Function approaches a finite value as x → ±∞ | y = L | Limit at infinity |
Slant Asymptote | End behavior approaches a non-horizontal line | y = mx + b | Degree numerator = degree denominator + 1 |
Additional info: This guide covers foundational concepts in limits and continuity, including graphical and algebraic techniques, and the classification of discontinuities and asymptotes. These topics are essential for further study in calculus and mathematical analysis.
