 Indietro
Graphing Linear Equations Using Intercepts
Guida di studio - Note intelligenti
 Appunti personalizzati basati sui tuoi materiali, ampliati con definizioni chiave, esempi e contesto.
Graphing Linear Equations Using Intercepts
Introduction to Linear Equations and Intercepts
Linear equations in two variables can be represented graphically as straight lines. The standard form of a linear equation is Ax + By = C, where A and B are not both zero. To graph these equations efficiently, we use two key points: the x-intercept and the y-intercept.
Identifying Intercepts
X-Intercept
The x-intercept is the point where the graph of an equation crosses the x-axis. At this point, the value of y is always zero. To find the x-intercept, set y = 0 in the equation and solve for x.
Definition: The x-coordinate of the point where the graph crosses the x-axis (y = 0).
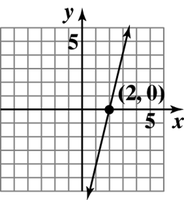
Example: The graph crosses the x-axis at (2, 0), so the x-intercept is 2.
Y-Intercept
The y-intercept is the point where the graph of an equation crosses the y-axis. At this point, the value of x is always zero. To find the y-intercept, set x = 0 in the equation and solve for y.
Definition: The y-coordinate of the point where the graph crosses the y-axis (x = 0).
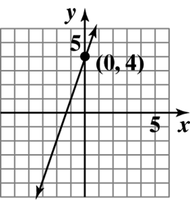
Example: The graph crosses the y-axis at (0, 4), so the y-intercept is 4.
Examples: Identifying Intercepts from Graphs
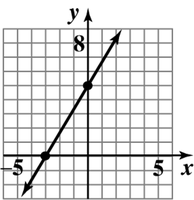
Example 1: The graph crosses the x-axis at (-3, 0) and the y-axis at (0, 5). Thus, the x-intercept is -3 and the y-intercept is 5.
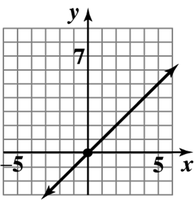
Example 2: The graph crosses both axes at (0, 0). Thus, both the x-intercept and y-intercept are 0.
Graphing Linear Equations Using Intercepts
Procedure for Graphing
To graph a linear equation in two variables using intercepts, follow these steps:
Find the x-intercept: Set y = 0 and solve for x.
Find the y-intercept: Set x = 0 and solve for y.
Find a checkpoint: Choose another value for x (or y), substitute it into the equation, and solve for the other variable to get a third point.
Draw the line: Plot the intercepts and the checkpoint, then draw a straight line through them.
Example: Graphing with Intercepts and a Checkpoint
Equation: Suppose we have a linear equation.
Step 1: Find the x-intercept by letting y = 0 and solving for x.
Step 2: Find the y-intercept by letting x = 0 and solving for y.
Step 3: Find a checkpoint by choosing another value for x (e.g., x = 1) and solving for y.
Step 4: Plot the points and draw the line.
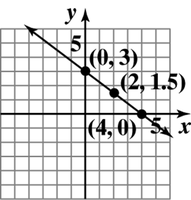
Example: For a line passing through (4, 0), (0, 3), and (2, 1.5):
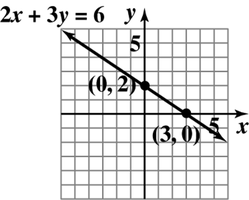
Example: Graphing 2x + 3y = 6
x-intercept: Set y = 0:
y-intercept: Set x = 0:
Checkpoint: Choose x = 1:
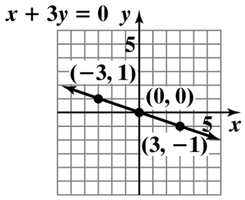
Example: Graphing x + 3y = 0
x-intercept: Set y = 0:
y-intercept: Set x = 0:
Additional points: For y = -1, ; for y = 1,
Use the points (0, 0), (3, -1), and (-3, 1) to draw the line.
Graphing Horizontal and Vertical Lines
Horizontal Lines
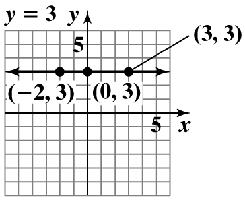
A horizontal line has the equation y = k, where k is a constant. All points on the line have the same y-value, and the line is parallel to the x-axis.
Example: y = 3. All points have y = 3, such as (-2, 3), (0, 3), and (3, 3).
Vertical Lines
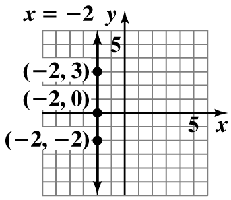
A vertical line has the equation x = h, where h is a constant. All points on the line have the same x-value, and the line is parallel to the y-axis.
Example: x = -2. All points have x = -2, such as (-2, 3), (-2, 0), and (-2, -2).
Summary Table: Intercepts and Line Types
Type of Line | Equation Form | Intercepts | Graph Description |
|---|---|---|---|
General Linear | Ax + By = C | x-intercept: set y=0 y-intercept: set x=0 | Straight line, not vertical or horizontal |
Horizontal | y = k | y-intercept: (0, k) | Parallel to x-axis |
Vertical | x = h | x-intercept: (h, 0) | Parallel to y-axis |
Additional info: Checkpoints are used to confirm the accuracy of the line and to provide a third point for more precise graphing. For equations where the constant term is zero, the line passes through the origin (0, 0).
