 Indietro
Business Calculus Exam 1 Review: Functions, Limits, Derivatives, and Business Applications
Guida di studio - Note intelligenti
 Appunti personalizzati basati sui tuoi materiali, ampliati con definizioni chiave, esempi e contesto.
Functions and Algebra Review
Function Notation and Properties
Functions describe the relationship between an input variable and an output. In business calculus, understanding function notation and properties is foundational for modeling and analysis.
Function notation: means input produces output .
Domain: Set of allowed inputs; Range: Set of possible outputs.
Intercepts: x-intercepts solve ; y-intercept is , if defined.
Vertical line test: A graph represents a function if every vertical line intersects it at most once.
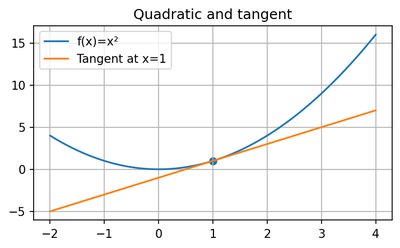
Example: For , ; intercept at ; domain ; range .
Operations on Functions
Functions can be combined using arithmetic operations and composition. The domain of the resulting function must satisfy all restrictions from the components.
Addition:
Subtraction:
Multiplication:
Division: ,
Composition:
Linear Functions and Business Models
Linear functions model constant rates of change and are widely used in business for cost, revenue, and profit analysis.
Slope:
Slope-intercept form:
Point-slope form:
Average rate of change:
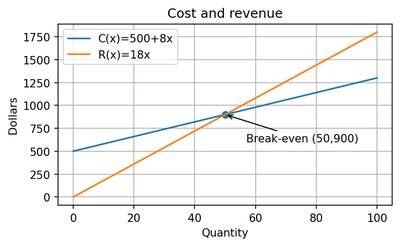
Cost model: (fixed cost , variable cost per unit )
Revenue: (constant price )
Profit:
Break-even: or
Example: , , . Break-even at units, both cost and revenue are $900$.
Exponents and Quadratics
Exponent rules and quadratic functions are essential for simplifying expressions and solving equations in calculus and business applications.
Exponent rules:
,
,
Quadratic standard form:
Vertex:
Quadratic formula:
Discriminant: (positive: two real roots; zero: one root; negative: no real roots)
Polynomials and Rational Functions
Polynomials and rational functions are used to model more complex business scenarios, including cost and revenue functions with nonlinear behavior.
Rational function: ,
Zeros: x-intercepts of the numerator
Vertical asymptotes: Uncanceled zeros of the denominator
Removable discontinuity (hole): Canceled factor in numerator and denominator
End behavior: Determined by the leading term (highest degree) of numerator and denominator
Exponential and Logarithmic Functions
Exponential and logarithmic functions are crucial for modeling growth, decay, and other business phenomena involving rapid change.
Exponential model: , ,
Continuous growth/decay:
Logarithm definition:
Log properties:
Change of base:
Inverse relationships: ,
Limits and Continuity
Limit Concepts and Techniques
Limits describe the behavior of functions as inputs approach specific values. They are foundational for defining derivatives and continuity.
Limit notation:
Direct substitution: For continuous functions, substitute .
Indeterminate forms (0/0): Simplify, factor, or rationalize before substituting.
End behavior: For , compare degrees of numerator and denominator.
One-sided limits: (from left), (from right)
Limit laws: Limits distribute over sums, differences, products, and quotients (if denominator's limit is nonzero).
Continuity and Types of Discontinuity
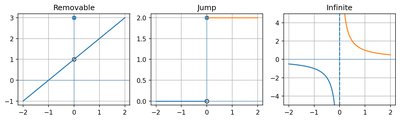
A function is continuous at if it is defined there, the limit exists, and the limit equals the function value. Discontinuities are classified as removable, jump, or infinite.
Continuity at : (1) is defined; (2) exists; (3)
Removable discontinuity: Limit exists, but function value is missing or different (hole).
Jump discontinuity: Left and right limits are finite but unequal.
Infinite discontinuity: Function values become unbounded (vertical asymptote).
Derivatives and Their Rules
Definition of the Derivative
The derivative measures the instantaneous rate of change of a function, interpreted as the slope of the tangent line at a point.
Average rate of change:
Derivative at :
General derivative:
Tangent line at :
Rules for Differentiation
Several rules simplify the process of finding derivatives for common functions and combinations.
Constant rule:
Power rule:
Constant multiple:
Sum/difference:
Product rule:
Quotient rule: ,
Chain rule:
Exponential: ,
Logarithm: ,
Example:
Business Applications: Demand, Cost, Revenue, and Profit
Key Business Functions and Relationships
Business calculus applies mathematical models to analyze demand, cost, revenue, profit, and break-even points.
Concept | Formula | Key Interpretation |
|---|---|---|
Demand (D) | p = p(q) | Relationship between price and quantity sold |
Cost (C or TC) | TC(q) = FC + TVC(q) | Total cost to produce q items |
Revenue (R or TR) | TR(q) = p(q) \cdot q | Money received from selling q items |
Profit (P) | P(q) = TR(q) - TC(q) | Revenue minus total cost |
Average cost (AC) | AC(q) = TC(q)/q | Cost per item on average |
Break-even | R(x)=C(x) | Profit is zero |
Demand and Revenue Models
Demand and revenue functions are often quadratic, and their analysis involves finding maximum revenue and feasible domains.
Inverse demand: ;
General demand: ;
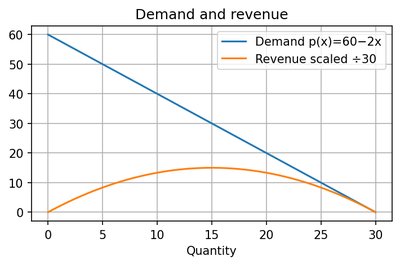
Maximum revenue: Find critical point of (solve ) or use vertex formula
Feasible domain: ,
Example: , . At , price is $40. Feasible domain: .
Marginal Analysis
Marginal cost, revenue, and profit are derivatives of the total functions and estimate the change from producing or selling one additional unit.
Marginal cost:
Marginal revenue:
Marginal profit:
Approximation:
If , profit is increasing; if , profit is decreasing. Maximum profit may occur where .
Asymptotes and Graph Features
Vertical and Horizontal Asymptotes
Asymptotes describe the end behavior and undefined points of rational functions.
Vertical asymptote: Uncanceled zero of denominator; function grows without bound near this -value.
Removable discontinuity (hole): Canceled factor in numerator and denominator.
Horizontal asymptote:
If numerator degree (denominator):
If : ratio of leading coefficients
If : slant (oblique) asymptote; use polynomial division
Example: for ; hole at , not a vertical asymptote.
Exam Skills and Checklist
Define variables and units before modeling.
Write governing relationships first (e.g., , ).
Show algebraic steps clearly, especially with parentheses and factoring.
For break-even, solve and interpret in context.
For limits, check one-sided behavior and distinguish holes from asymptotes.
For marginal analysis, differentiate and explain the meaning of the result.
Check domain restrictions and ensure answers make sense for the business context.
For graph questions, identify intercepts, domain, range, holes, jumps, vertical asymptotes, and end behavior.
