 Indietro
Business Calculus: Linear Functions and Their Applications
Guida di studio - Note intelligenti
 Appunti personalizzati basati sui tuoi materiali, ampliati con definizioni chiave, esempi e contesto.
Linear Functions
Introduction to Linear Functions
Linear functions are foundational in business calculus, modeling relationships with constant rates of change. They are widely used in economics, finance, and business decision-making.
Definition: A linear function is any function of the form , where m is the slope and b is the y-intercept.
Applications: Linear functions describe cost, revenue, supply, demand, and other business relationships.
Cartesian Coordinate System
Understanding the Coordinate Plane
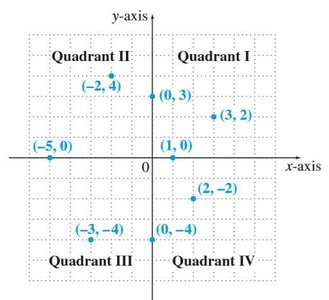
The Cartesian coordinate system is used to graphically represent equations and relationships between variables.
Axes: The horizontal axis is the x-axis, and the vertical axis is the y-axis.
Quadrants: The plane is divided into four quadrants, each with different sign combinations for (x, y).
Intercepts: The x-intercept is where the graph crosses the x-axis (y = 0), and the y-intercept is where it crosses the y-axis (x = 0).
Slopes and Equations of Lines
Slope of a Line
The slope measures the steepness and direction of a line.
Formula: For two points and , the slope is given by:
Interpretation: A positive slope rises left to right; a negative slope falls left to right.
Special Cases: Horizontal lines have slope 0; vertical lines have undefined slope.
Forms of Linear Equations
Linear equations can be written in several standard forms, each useful for different applications.
Slope-Intercept Form:
Point-Slope Form:
Vertical Line: (undefined slope)
Horizontal Line: (slope 0)


Parallel and Perpendicular Lines
Parallel Lines: Two lines are parallel if they have the same slope or are both vertical.
Perpendicular Lines: Two lines are perpendicular if the product of their slopes is (i.e., ), or if one is vertical and the other is horizontal.
Linear Functions and Applications
Function Notation and Evaluation
Function notation expresses the output of a function for a given input. For example, if , then .
Notation: or denotes the value of the function at .
Linear Function:
Supply and Demand Functions
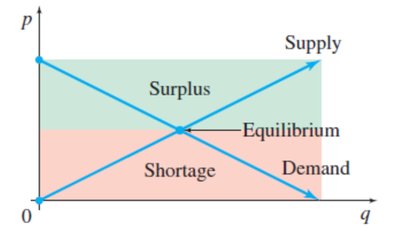
Linear functions are used to model supply and demand in economics.
Demand Function: (price decreases as quantity increases)
Supply Function: (price increases as quantity increases)
Equilibrium: The point where supply equals demand () determines the equilibrium price and quantity.
Example: Tuition and Fees
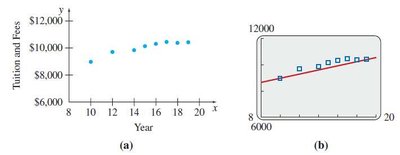
Linear models can be used to analyze trends in real-world data, such as tuition costs over time.
Application: Fitting a line to data points helps predict future values and analyze trends.
Cost, Revenue, and Profit Functions
Linear Cost Function
A linear cost function models the total cost of producing items.
Formula:
Marginal Cost (m): The cost to produce one additional unit.
Fixed Cost (b): The cost incurred even when no units are produced.
Revenue and Profit Functions
Revenue Function: , where is the price per unit.
Profit Function:
Break-Even Analysis
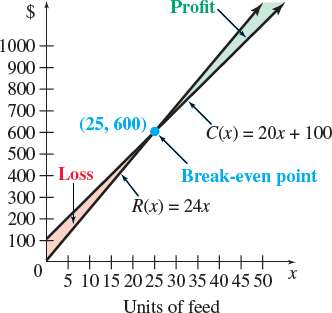
The break-even point is where total revenue equals total cost, resulting in zero profit or loss.
Break-Even Quantity: Set and solve for .
Break-Even Point: The ordered pair where this occurs.
Applications: Temperature Conversion
Linear Relationship Between Celsius and Fahrenheit
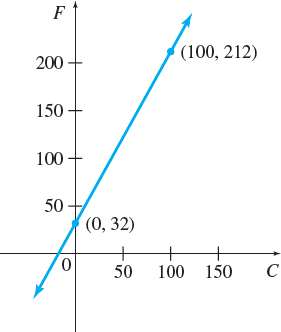
Temperature conversion between Celsius and Fahrenheit is a classic example of a linear function.
Formula:
Graph: The relationship is a straight line with slope and y-intercept 32.
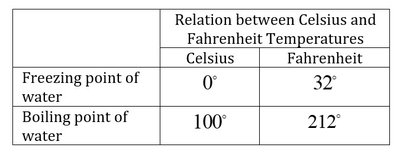
Relation between Celsius and Fahrenheit Temperatures | ||
|---|---|---|
Freezing point of water | 0° C | 32° F |
Boiling point of water | 100° C | 212° F |
Summary Table: Forms of Linear Equations
Equation | Description |
|---|---|
Slope-intercept form: slope , y-intercept | |
Point-slope form: slope , line passes through | |
Vertical line: x-intercept , undefined slope | |
Horizontal line: y-intercept , slope 0 |
