 Indietro
Business Calculus Study Notes: Functions and Graphs
Guida di studio - Note intelligenti
 Appunti personalizzati basati sui tuoi materiali, ampliati con definizioni chiave, esempi e contesto.
Functions and Graphs
Learning Objectives
Understand how to plot the graph of equations in two variables.
Gain skill in plotting and reading graphs of functions.
Interpret the meaning of functions in business contexts.
Use function notation and analyze function behavior.
Cartesian Coordinate System
Definition and Plotting Points
The Cartesian Coordinate System is a method for graphing equations in two variables. Each point is represented by an ordered pair (x, y), where x is the horizontal coordinate and y is the vertical coordinate. The intersection of the axes is called the origin (0,0).
Ordered Pair: (x, y) represents a point in the plane.
Axes: The horizontal axis is called the x-axis, and the vertical axis is the y-axis.
Origin: The point (0, 0) where the axes intersect.
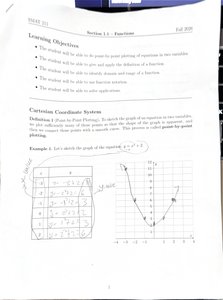
Example: Plotting the Graph of y = x2
To plot the graph of y = x^2, create a table of values for x and y, then plot each point and connect them to form the graph.
Choose values for x (e.g., -2, -1, 0, 1, 2).
Calculate y for each x using the equation y = x^2.
Plot the points (x, y) on the coordinate plane.
The graph forms a parabola opening upwards.
Example Table:
x | y = x^2 |
|---|---|
-2 | 4 |
-1 | 1 |
0 | 0 |
1 | 1 |
2 | 4 |
Functions in Business Contexts
Function Notation and Application
A function is a rule that assigns each input value (usually x) to exactly one output value (usually y or f(x)). In business, functions are used to model relationships such as cost, revenue, and profit.
Function Notation: f(x) represents the output when x is the input.
Domain: The set of all possible input values (x) for which the function is defined.
Range: The set of all possible output values (y).
Example: If C(x) is the cost to produce x units, then C(x) is a function of x.
Business Function Examples
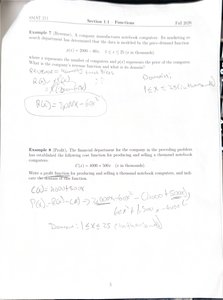
Revenue Function: R(x) = price per unit × number of units sold.
Cost Function: C(x) = fixed costs + variable costs × number of units.
Profit Function: P(x) = R(x) - C(x).
Example: If a company manufactures notebooks, and the cost function is C(x) = 2000 + 5x, the revenue function is R(x) = 7x, then the profit function is:
Domain: The domain is restricted by business constraints, such as minimum and maximum production levels.
Elementary Functions
Types of Elementary Functions and Their Graphs
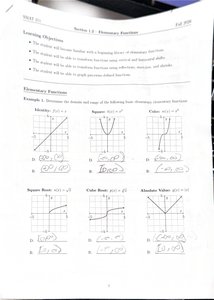
Elementary functions are basic functions commonly used in calculus and business applications. Understanding their graphs and domains is essential for analyzing more complex functions.
Identity Function:
Square Function:
Cubic Function:
Square Root Function:
Cube Root Function:
Absolute Value Function:
Each function has a characteristic graph and domain:
Function | Equation | Domain | Graph Description |
|---|---|---|---|
Identity | All real numbers | Straight line through origin | |
Square | All real numbers | Parabola opening upwards | |
Cubic | All real numbers | S-shaped curve | |
Square Root | Starts at origin, increases slowly | ||
Cube Root | All real numbers | Curve passing through origin | |
Absolute Value | All real numbers | V-shaped graph |
Applications
Elementary functions are used to model simple business relationships.
Understanding their domains helps avoid errors in calculations and interpretations.
