 Indietro
Continuity and Sign Charts in Business Calculus
Guida di studio - Note intelligenti
 Appunti personalizzati basati sui tuoi materiali, ampliati con definizioni chiave, esempi e contesto.
Continuity of Functions
Informal Definition of Continuity
A function is continuous over an interval if its graph can be drawn without lifting the pen from the paper. This means there are no breaks, jumps, or holes in the graph within that interval.
Continuous Function: The graph is unbroken for all values in the interval.
Discontinuous Function: The graph is broken or disconnected at one or more points.
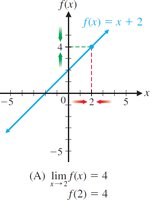
Example: The function f(x) = x + 2 is continuous for all x.
Discontinuity
If a graph is broken at a point x = c, the function is discontinuous at that point. Discontinuity can occur due to undefined values, jumps, or holes in the graph.
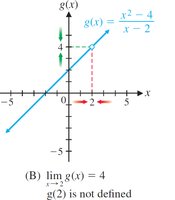
Example: The function g(x) = \frac{x^2 - 4}{x - 2} is continuous except at x = 2, where it is not defined.
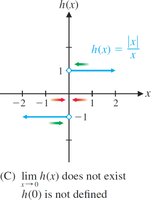
Example: The function h(x) = \frac{|x|}{x} is discontinuous at x = 0 but continuous elsewhere.
Formal Definition of Continuity
A function f is continuous at x = c if the following three conditions are satisfied:
f(c) is defined
\lim_{x \to c} f(x) exists
\lim_{x \to c} f(x) = f(c)
If any of these conditions fail, the function is discontinuous at x = c.
Continuity on Intervals
A function is continuous on an open interval (a, b) if it is continuous at every point in that interval. For closed intervals [a, b], continuity must also be checked at the endpoints using one-sided limits.
One-sided Continuity
Continuous on the right at x = c: The function is continuous as x approaches c from the right.
Continuous on the left at x = c: The function is continuous as x approaches c from the left.
Continuous on [a, b]: The function is continuous on (a, b), continuous on the right at a, and continuous on the left at b.
General Continuity Properties
Algebraic Operations
If two functions are continuous on the same interval, their sum, difference, product, and quotient (except where the denominator is zero) are also continuous on that interval.
Theorem 1: Continuity Properties of Specific Functions
Constant Function: f(x) = k is continuous for all x.
Power Function: f(x) = x^n (n positive integer) is continuous for all x.
Polynomial Function: Continuous for all x.
Rational Function: Continuous for all x except where the denominator is zero.
Root Functions: f(x) = \sqrt[n]{g(x)} is continuous wherever g(x) is continuous and, for even n, nonnegative.
Examples of Continuity
Example 1: A polynomial function is continuous everywhere.
Example 2: A rational function is continuous except at points where the denominator is zero.
Example 3: An odd root function is continuous everywhere; an even root function is continuous where the radicand is nonnegative.
Sign Charts and Solving Inequalities
Sign Charts
A sign chart is a tool used to analyze the sign (positive or negative) of a function over different intervals. It is especially useful for solving inequalities and understanding the behavior of functions.
Partition Numbers: Values where the function is discontinuous or equals zero. These divide the real number line into intervals.
Procedure:
Find all partition numbers (where function is discontinuous or zero).
Plot these numbers on the real number line, dividing it into intervals.
Select a test number in each interval and evaluate the function to determine its sign.
Construct the sign chart to show the sign of the function in each interval.
Theorem 2: Sign Properties on an Interval
If f is continuous on (a, b) and f(x) \neq 0 for all x in (a, b), then f(x) is either always positive or always negative on (a, b).
Example: Solving an Inequality
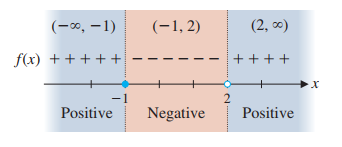
Consider the function f(x) = \frac{x + 1}{x - 2}. The partition numbers are x = -1 (numerator zero) and x = 2 (denominator zero). The sign chart shows:
f(x) is positive on (-\infty, -1) and (2, \infty)
f(x) is negative on (-1, 2)
Example: Positive Profit
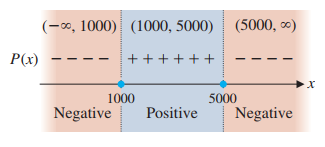
A bakery's profit function P(x) = -0.0005x^2 + 3x - 2000 is continuous everywhere. Partition numbers are found by factoring and setting P(x) = 0, yielding x = 1000 and x = 5000. The sign chart shows:
P(x) is positive for 1000 < x < 5000
P(x) is negative for x < 1000 and x > 5000
The bakery should produce between 1000 and 5000 loaves to make a profit.
Summary Table: Continuity Properties
Function Type | Continuity |
|---|---|
Constant | Continuous everywhere |
Polynomial | Continuous everywhere |
Rational | Continuous except where denominator is zero |
Root (odd index) | Continuous wherever radicand is continuous |
Root (even index) | Continuous where radicand is continuous and nonnegative |
