Skip to main content
Statistics for Business
Il mio corso
Impara
Preparazione agli esami
AI Tutor
Guide di studio
Flashcard
Esplora
Prova l'app
Il mio corso
Impara
Preparazione agli esami
AI Tutor
Guide di studio
Flashcard
Esplora
Prova l'app
Indietro
3. Describing Data Numerically
Scarica il foglio di lavoro
Problema 1
Problema 2
Problema 3
Problema 4
Problema 5
Problema 6
Problema 7
Problema 8
Problema 9
Problema 10
Problema 11
Problema 12
Problema 13
Problema 14
Problema 15
Problema 16
Problema 17
Problema 18
Problema 19
3. Describing Data Numerically
Scarica il foglio di lavoro
Esercitati
Sommario
Precedente
13 di 19
Prossimo
3. Describing Data Numerically / Standard Deviation / Problema 13
Problema 13
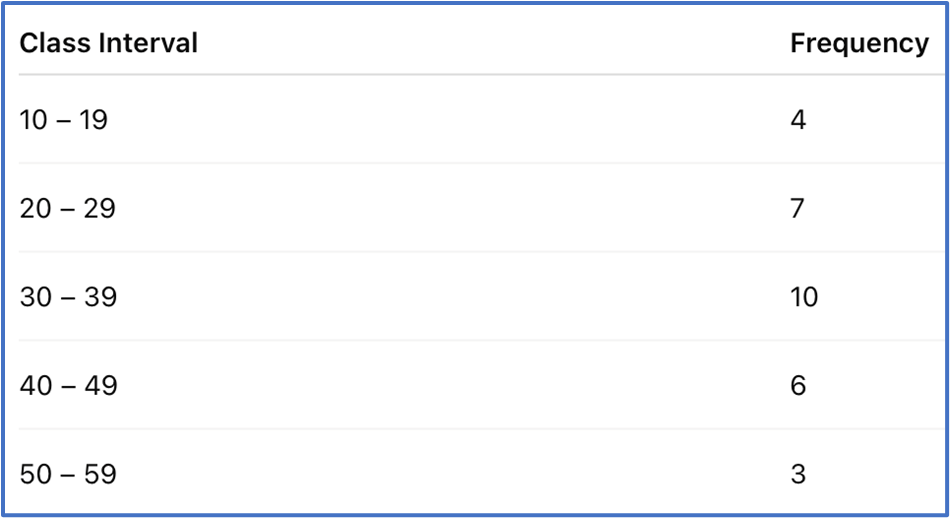
Using the class midpoints and corresponding frequencies, estimate the sample mean and standard deviation of the provided data.
A
x
ˉ
=
33.5
\(\bar{x}\)=33.5
s
=
13.2
s=13.2
B
x
ˉ
=
38.0
\(\bar{x}\)=38.0
s
=
11.9
s=11.9
C
x
ˉ
=
33.5
\(\bar{x}\)=33.5
s
=
11.9
s=11.9
D
x
ˉ
=
38.0
\(\bar{x}\)=38.0
s
=
13.2
s=13.2
Tutor AI
0
0 Commenti
Mostra la risposta
Più opzioni