2. Describing Data with Tables and Graphs
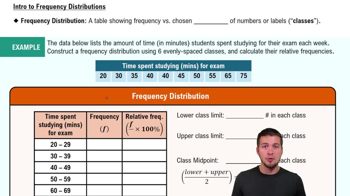
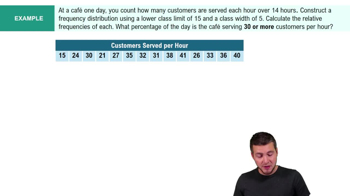
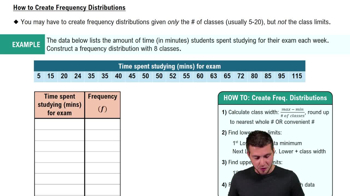
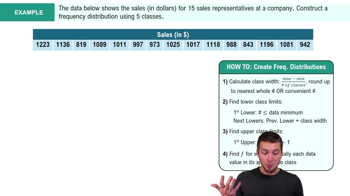
Frequency Distributions
2. Describing Data with Tables and Graphs
Frequency Distributions
 06:38
06:38

Esercitati su questo argomento
- Scelta multipla
Use the frequency distribution below to find the class width and class midpoints.
373views4rank - Scelta multipla
The following data set shows the number of overtime hours that 12 employees worked in a month. Construct a frequency distribution, using a lower class limit of 3 and a class width of 4.
250views6rank - Scelta multipla
An economist is analyzing the monthly unemployment rates (as a %) across different cities. The lowest was 16% and the highest was 71%. Without constructing a table, find the class width if this data is divided into 7 classes. Then write the lower and upper class limits for each class.
276views1rank