 Indietro
Confidence Intervals in Business Statistics: Concepts, Calculations, and Applications
Guida di studio - Note intelligenti
 Appunti personalizzati basati sui tuoi materiali, ampliati con definizioni chiave, esempi e contesto.
Ch. 8 = Confidence Intervals
Introduction to Confidence Intervals
Confidence intervals are a fundamental concept in inferential statistics, providing a range of values within which a population parameter is expected to lie with a specified probability. They are widely used in business statistics to estimate population means and proportions based on sample data.
Point Estimate: A single value (e.g., sample mean) used as the best estimate of an unknown population parameter.
Interval Estimate: A range of values, derived from sample statistics, that is likely to contain the population parameter.
Confidence Level: The probability (expressed as a percentage, such as 90%, 95%, or 99%) that the confidence interval contains the true population parameter.
Margin of Error (ME): The amount added and subtracted from the point estimate to form the confidence interval.
Example: If a sample mean is 100 and the margin of error is 5, a 95% confidence interval is (95, 105).
Theories Underlying Confidence Intervals
Empirical Rule: For a normal distribution:
Approximately 68% of values fall within ±1 standard deviation from the mean.
Approximately 95% within ±2 standard deviations.
Approximately 99.7% within ±3 standard deviations.
Central Limit Theorem (CLT): For large sample sizes (n ≥ 30), the sampling distribution of the sample mean is approximately normal, regardless of the population's distribution.
Critical Values and Confidence Levels
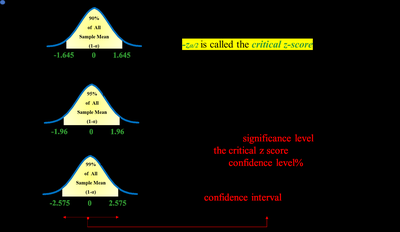
The critical value (zα/2 or tα/2) determines the width of the confidence interval for a given confidence level. Common z-scores for confidence levels are:
Confidence Level | Significance Level (α) | zα/2 |
|---|---|---|
90% | 0.10 | 1.645 |
95% | 0.05 | 1.96 |
99% | 0.01 | 2.575 |
Calculating Confidence Intervals for the Population Mean
When Population Standard Deviation (σ) is Known
Use the z-distribution when σ is known and either n ≥ 30 or the population is normally distributed.
Formula:
Where:
= sample mean
= population standard deviation
= sample size
= critical z-score for the desired confidence level
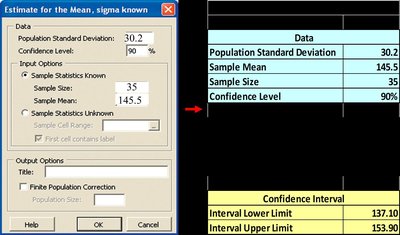
Example: A sample of 35 flights has a mean of 145.5 and σ = 30.2. For a 90% confidence interval:
Standard error:
Critical value:
Interval:
Finite Population Correction
When the sample size is a significant fraction of the population (n/N > 0.05), apply the finite population correction (FPC):
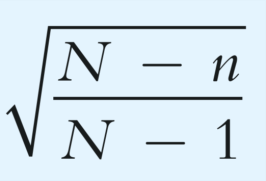
The confidence interval formulas become:


When Population Standard Deviation (σ) is Unknown
Use the t-distribution when σ is unknown and the population is normally distributed. The sample standard deviation (s) is used in place of σ.
Formula:
Where:
= critical t-score with degrees of freedom
= sample standard deviation
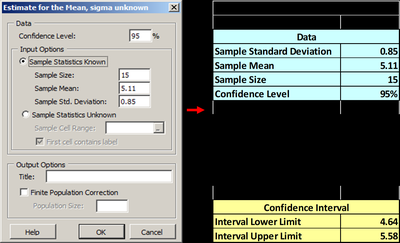
Example: A sample of 15 patients has a mean of 5.11 days and s = 0.85. For a 95% confidence interval (df = 14, ):
Standard error:
Interval:
Finite Population Correction for t-Distribution
When using the t-distribution and the sample is a significant fraction of the population, apply the FPC:


Calculating Confidence Intervals for Proportions
Confidence Interval for a Population Proportion
Proportion data often follow the binomial distribution, which can be approximated by the normal distribution if and .
Formula:
Where:
= sample proportion ()
= sample size
= critical z-score
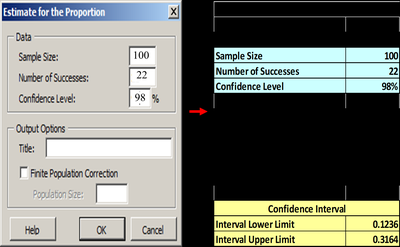
Example: In a sample of 100 people, 22 have blue eyes. For a 98% confidence interval ():
Standard error:
Interval:
Finite Population Correction for Proportions
When the sample is a significant fraction of the population, apply the FPC to the standard error:
The confidence interval formulas become:


Summary Table: Types of Confidence Intervals
Type | Population Parameter | Distribution | Formula |
|---|---|---|---|
Type 1 | Mean (σ known) | Normal (z) | |
Type 2 | Mean (σ unknown) | t-distribution | |
Type 3 | Proportion | Normal (z) |
Key Takeaways
Confidence intervals provide a range of plausible values for population parameters.
The width of the interval depends on the confidence level, sample size, and variability in the data.
Finite population correction should be applied when the sample is a significant fraction of the population.
Use the z-distribution when σ is known, and the t-distribution when σ is unknown and the population is normal.
For proportions, ensure the sample size is large enough for the normal approximation to be valid.
