 Indietro
Hypothesis Testing for Two Samples: Means and Proportions
Guida di studio - Note intelligenti
 Appunti personalizzati basati sui tuoi materiali, ampliati con definizioni chiave, esempi e contesto.
Ch. 10
Hypothesis Testing for Two Samples
Overview
Hypothesis testing for two samples is a fundamental technique in business statistics used to compare population parameters such as means and proportions. This chapter focuses on the procedures for testing claims about differences between two population means or proportions using independent or dependent samples. The methods covered include both z-tests and t-tests, depending on whether population standard deviations are known or unknown.
Decision Rules for Hypothesis Tests
Comparing Test Statistics to Critical Values
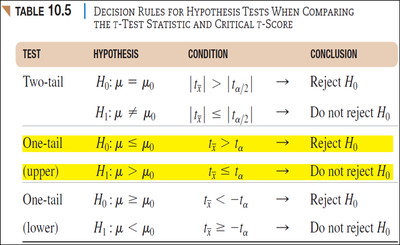
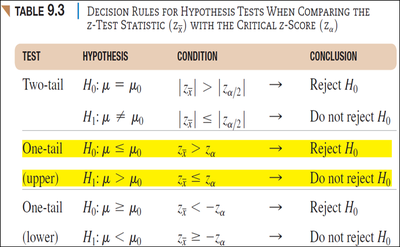
To determine whether to reject the null hypothesis, compare the calculated test statistic (z or t) to the critical value from the appropriate statistical table. The decision rules differ based on the type of test (one-tail or two-tail) and the hypothesis being tested.
Two-tail test: Used when testing for any difference (not direction-specific) between two parameters.
One-tail test: Used when testing for a difference in a specific direction (greater or less).
Test | Hypothesis | Condition | Conclusion |
|---|---|---|---|
Two-tail | Reject | ||
Two-tail | Do not reject | ||
One-tail (upper) | Reject | ||
One-tail (upper) | Do not reject | ||
One-tail (lower) | Reject | ||
One-tail (lower) | Do not reject |
Comparing Two Population Means with Independent Samples
Known Population Standard Deviations ( and )
When the population standard deviations are known, the z-test is used to compare the means of two independent samples. The sampling distribution for the difference in means is calculated, and the standard error describes the variation between sample means.
Formula for the mean of the sampling distribution:
Formula for the standard error:
Test statistic:
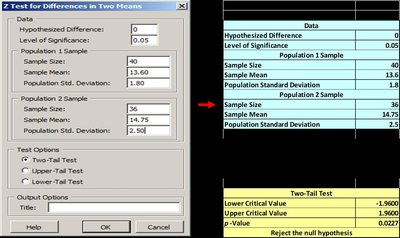
Example: Comparing average spending at baseball games in Chicago and New York.
Chicago: , ,
New York: , ,
Null hypothesis:
Alternative hypothesis:
Significance level:
Critical value:
Calculated test statistic:
Conclusion: , so reject
Application Example: Major League Baseball Game Lengths
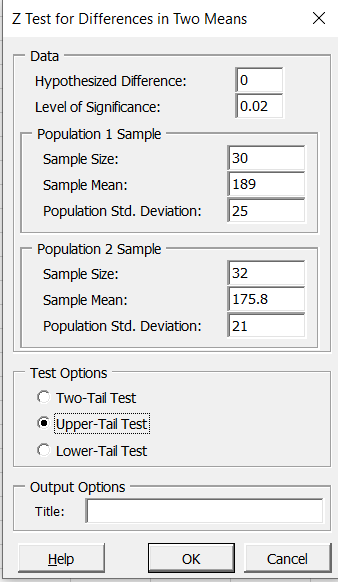
Testing whether playoff games are longer than regular season games using a one-tail test.
Playoff games: , ,
Regular games: , ,
Null hypothesis:
Alternative hypothesis:
Significance level:
Critical value:
Calculated test statistic:
Conclusion: , so reject
Comparing Two Population Means with Unknown Standard Deviations
Equal and Unequal Variances
When population standard deviations are unknown, the t-test is used. If variances are assumed equal, a pooled variance is calculated. If not, separate variances are used.
Pooled variance formula:
Test statistic (equal variances):
Test statistic (unequal variances):
Degrees of freedom: (equal variances), or calculated using a formula for unequal variances.

Example: Comparing Travel Times
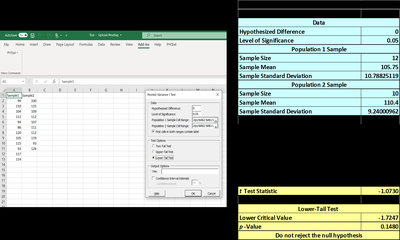
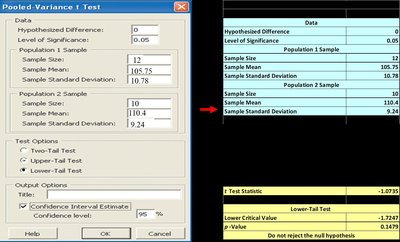
Testing whether Bob's route is faster than Deb's using a one-tail t-test with equal variances.
Bob: , ,
Deb: , ,
Null hypothesis:
Alternative hypothesis:
Significance level:
Critical value:
Calculated test statistic:
Conclusion: , so do not reject
Comparing Two Population Proportions with Independent Samples
Hypothesis Testing for Proportions
Used to compare proportions between two populations, such as the proportion of customers using online banking in different age groups.
Formula for standard error:
Test statistic:
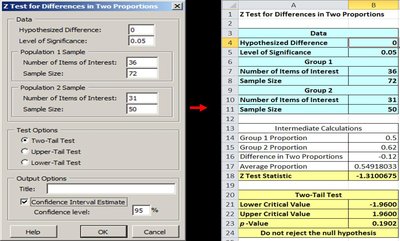
Example: Comparing proportions of men and women voting YES on a proposition.
Men: , ,
Women: , ,
Null hypothesis:
Alternative hypothesis:
Significance level:
Critical value:
Calculated test statistic:
Conclusion: , so do not reject
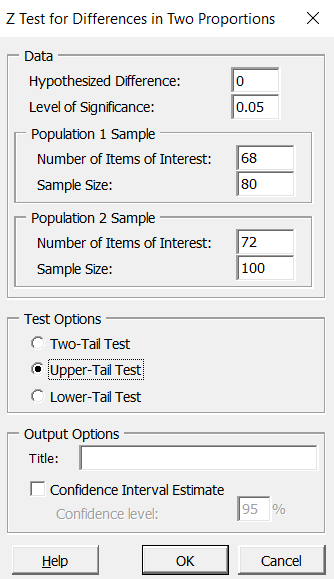
Application Example: Online Banking Usage
Testing whether younger customers use online banking more than older customers using a one-tail test.
Younger: , ,
Older: , ,
Null hypothesis:
Alternative hypothesis:
Significance level:
Critical value:
Calculated test statistic:
Conclusion: , so reject
Summary Table: Types of Two-Sample Tests
Test Type | Population Parameters | Sample Type | Distribution |
|---|---|---|---|
Two-sample z-test | Means, known , | Independent | Normal |
Two-sample t-test (pooled) | Means, unknown but equal , | Independent | t-distribution |
Two-sample t-test (unpooled) | Means, unknown and unequal , | Independent | t-distribution |
Two-sample z-test for proportions | Proportions | Independent | Normal |
Key Steps in Hypothesis Testing for Two Samples
Identify the null and alternative hypotheses (, )
Set the significance level ()
Determine the critical value (from z or t tables)
Calculate the test statistic (z or t)
Compare test statistic to critical value (decision rule)
State the conclusion (reject or do not reject )
Applications and Interpretation
Use hypothesis testing to compare business metrics across groups (e.g., spending, customer satisfaction, conversion rates).
Interpret results in context: rejecting means evidence supports a difference; failing to reject $H_0$ means no evidence for a difference.
Always check assumptions (normality, independence, equal variances) before applying tests.
