 Indietro
Introduction to Business Statistics: Foundations, Sampling, and Data Classification
Guida di studio - Note intelligenti
 Appunti personalizzati basati sui tuoi materiali, ampliati con definizioni chiave, esempi e contesto.
Introduction to Business Statistics
What is Business Statistics?
Business statistics is the mathematical science concerned with the collection, analysis, interpretation, and presentation of data for business decision-making. It transforms raw data into meaningful information using statistical tools and techniques, enabling managers to make informed decisions.
Statistics: The science of collecting, analyzing, and interpreting data.
Population: The entire set of items or individuals of interest.
Sample: A subset of the population, selected for analysis.
Variables: Characteristics or properties that can take different values (e.g., student grade).
Data: The actual values that variables assume (e.g., X = 90).
Example: Measuring the width of all cellphone covers in a warehouse (population = 1,000 covers) is often not feasible, so a sample (e.g., 50 covers) is measured instead.
Branches of Statistics
Descriptive Statistics: Summarizes and displays data using graphs, charts, and tables. It describes the main features of a dataset, either from a sample or the entire population.
Inferential Statistics: Makes predictions, estimates, or decisions about a population based on sample data and probability theory.
Example: Calculating the average income of a sample of students and using probability to estimate the average income of all students.
Descriptive vs. Inferential Statistics
Key Differences
Descriptive Statistics: Focuses on summarizing observed data (e.g., mean, median, mode, charts).
Inferential Statistics: Uses sample data to make generalizations or predictions about a population, often involving confidence intervals and hypothesis testing.
Examples:
"The stadium record shows that women count for 40% of the fans." (Descriptive)
"A recent poll showed that 75% of Americans had a favorable opinion of the president." (Inferential)
"The average exam score for my statistics exam was 88." (Descriptive)
"Predicting election results by asking voters about their intentions." (Inferential)
Applications of Statistics in Business
Marketing: Estimating population parameters, such as average income of a target group.
Operations: Analyzing associations between qualitative variables (e.g., gender and performance).
Finance & Economics: Examining relationships between quantitative variables (e.g., material price and house price).
Research Project Steps in Business Statistics
Overview of Steps
Define the Problem: Clearly state the business problem to be solved.
Define the Population/Sample: Identify the group of interest and select an appropriate sample using sampling methods.
Define the Nature of Data: Choose data collection methods and determine the level/type of data.
Use Statistical Tools: Apply descriptive and inferential statistical tools to process data and generate information.
Create Knowledge/Make Decisions: Interpret results to solve the business problem or make informed decisions.
Example: Investigating the relationship between employee age and productivity in a factory by sampling employees, collecting data via surveys, and analyzing with statistical tools.
Sampling Methods
Probability Sampling
Simple Random Sampling: Every member of the population has an equal chance of being selected.
Systematic Sampling: Every kth member is chosen, where (N = population size, n = sample size).
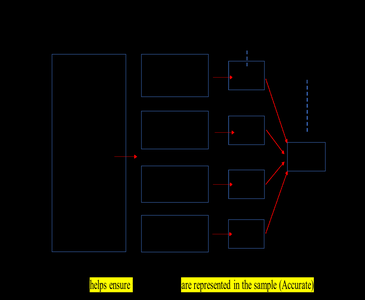
Stratified Sampling: Population is divided into strata (groups) based on important variables; a random sample is taken from each stratum.
Cluster Sampling: Population is divided into clusters (often geographically); entire clusters are randomly selected for the sample.
Resampling: Drawing many samples from a population, often using computer software (e.g., bootstrap method).
Example of Stratified Sampling: Dividing a student population into freshmen, sophomores, juniors, and seniors, then randomly sampling from each group to ensure all are represented.
Nonprobability Sampling
Convenience Sampling: Selecting samples that are easiest to access, which may not be representative.
Advantages: Quick and easy. Disadvantages: May lead to biased results.
Data Classification
Types of Data
Qualitative (Categorical) Data: Non-numerical, classified by attributes or characteristics (e.g., gender, type of car).
Quantitative (Numerical) Data: Numerical values, further divided into:
Discrete Variables: Countable values (e.g., number of students).
Continuous Variables: Measurable values, can take any value within a range (e.g., temperature).
Levels of Measurement
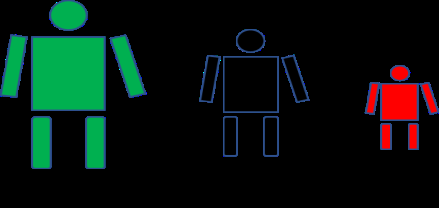
Nominal: Categories with no ranking (e.g., types of cars).
Ordinal: Categories with a meaningful order, but differences between ranks are not measurable (e.g., letter grades).
Interval: Ordered categories with measurable differences, but no true zero (e.g., IQ scores, temperature in Celsius).
Ratio: Like interval, but with a true zero point (e.g., price, number of items).
Data Collection Methods
Primary vs. Secondary Data
Primary Data: Collected directly by the researcher for a specific purpose (e.g., surveys, experiments, direct observation, interviews, focus groups).
Secondary Data: Collected by someone else and made available for use (e.g., government statistics, published reports).
Examples:
Measuring customer satisfaction for a new product: Primary data via survey.
Investigating the effect of price on demand: Primary data via experiment.
Determining inflation rate: Secondary data.
Measuring average wait time at a drive-through: Primary data via direct observation.
Ethics in Statistics
Common Ethical Issues
Biased Sample: Choosing a sample that does not represent the population, leading to distorted findings.
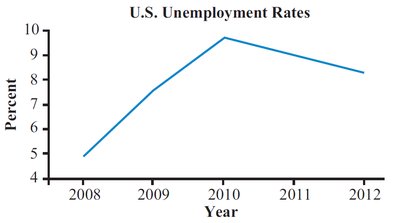
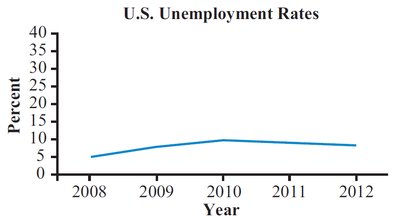
Misleading Graphs: Changing graph scales or omitting context to exaggerate or minimize trends.
Example: Two graphs showing U.S. unemployment rates can appear very different depending on the scale of the y-axis.
Summary Table: Sampling Methods
Sampling Method | Description | Example |
|---|---|---|
Simple Random | Every member has equal chance of selection | Randomly select 20 employees from a list |
Systematic | Select every k-th member | Every 3rd house on a street |
Stratified | Divide into strata, sample from each | Sample students from each grade level |
Cluster | Divide into clusters, sample entire clusters | Sample all homes on randomly chosen streets |
Convenience | Sample easiest to access | First 20 people entering a store |
Key Formulas
Systematic Sampling Constant:
N = Population size
n = Sample size
Conclusion
Understanding the foundations of business statistics—including types of data, sampling methods, and ethical considerations—is essential for effective data-driven decision-making in business environments. Mastery of these concepts enables accurate data collection, analysis, and interpretation, forming the basis for more advanced statistical techniques.
