 Indietro
Sampling Variation and Quality Control: Study Notes for Statistics for Business
Guida di studio - Note intelligenti
 Appunti personalizzati basati sui tuoi materiali, ampliati con definizioni chiave, esempi e contesto.
Sampling Variation and Quality Control
Introduction
Sampling variation and quality control are essential concepts in business statistics, particularly in manufacturing and service industries. These topics focus on understanding how sample statistics (such as means) vary from sample to sample, and how statistical tools like control charts are used to monitor and maintain process quality.
Sampling Distribution of the Mean
Understanding Sampling Variation
Sampling distribution of the mean describes how the sample mean varies from sample to sample when repeatedly sampling from the same population.
In manufacturing, such as testing GPS chips, managers use this concept to monitor production quality and detect process changes.
Variation is expected even in a properly functioning process; distinguishing between random variation and real process changes is crucial.
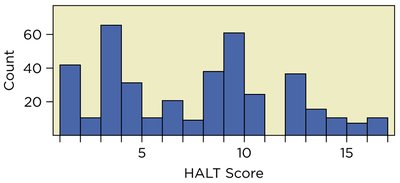
Distribution of Sample Means
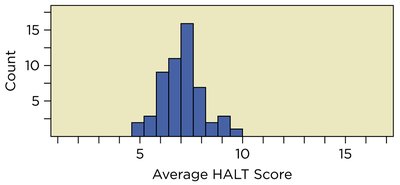
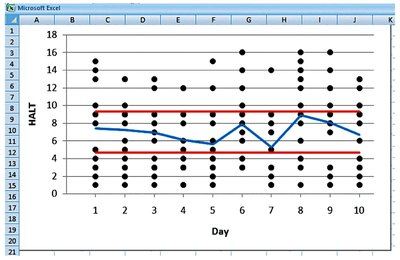
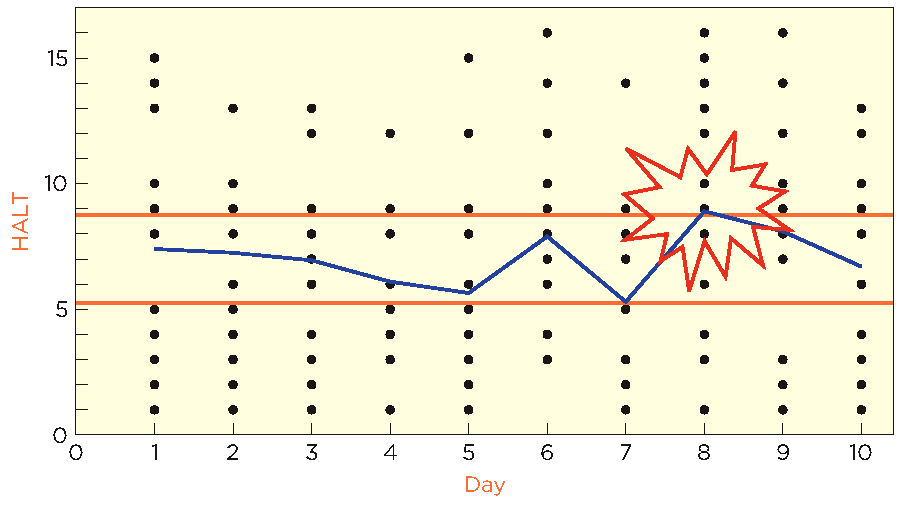
The distribution of sample means (e.g., average HALT scores for n=20) is more bell-shaped and less variable than the distribution of individual scores.
This reduction in variability is a key benefit of averaging.
Central Limit Theorem (CLT)
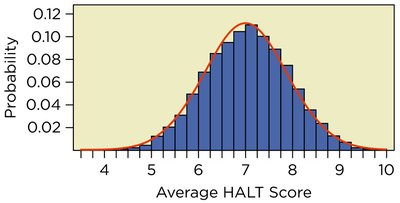
The Central Limit Theorem states that, for sufficiently large sample sizes, the sampling distribution of the mean is approximately normal, regardless of the population's distribution.
Sample size condition: A normal model is appropriate if .
Formula (Sample Mean Distribution):
Standard Error of the Mean
The standard error of the mean quantifies the variability of sample means:
As sample size increases, the standard error decreases, making the sample mean a more precise estimate of the population mean.
Sampling Distribution
The sampling distribution is the probability distribution of a statistic (e.g., mean) over all possible samples from the population.
Control Limits and Errors
Definition and Purpose of Control Limits
Control limits are boundaries on a control chart that help determine whether a process is in control or requires intervention.
They are typically set as symmetric intervals around the process mean: .
Upper Control Limit (UCL): ; Lower Control Limit (LCL): .
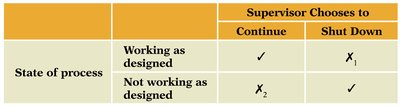
Type I and Type II Errors
Type I Error (\(\alpha\)): Taking action when no action is needed (false alarm).
Type II Error (\(\beta\)): Failing to take action when action is needed (missed detection).
State of process | Supervisor Chooses to Continue | Supervisor Chooses to Shut Down |
|---|---|---|
Working as designed | ✓ | ✗1 |
Not working as designed | ✗2 | ✓ |
Setting and Balancing Control Limits
Control limits are set based on the desired probability of a Type I error (commonly 5% or 1%).
Wider control limits reduce Type I errors but increase Type II errors, and vice versa.
Cannot minimize both errors simultaneously by adjusting limits alone.
Using Control Charts
X-Bar Chart
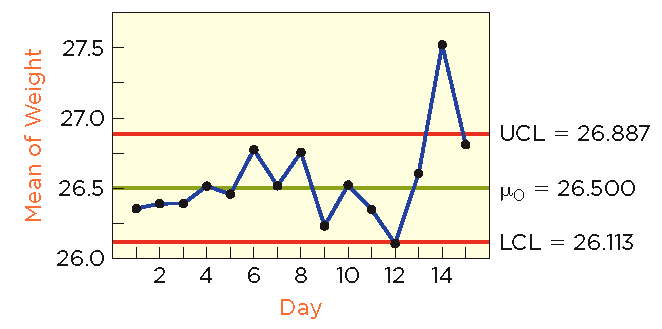
The X-bar chart tracks the mean of a process over time to detect shifts in the process mean.
Control limits are typically set at , where is the critical value for the desired confidence level.
For example, for 95% control limits, for 99% control limits.
Repeated Testing and Error Rates
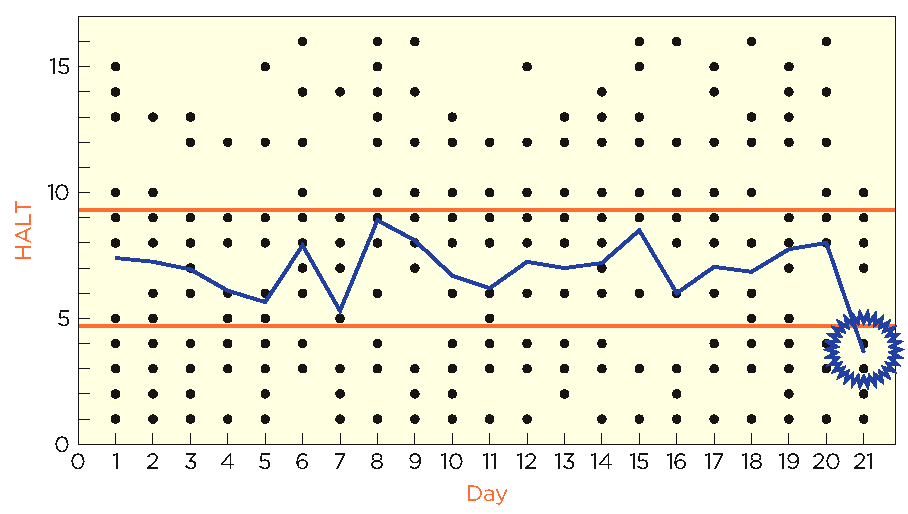
Repeated testing increases the cumulative probability of a Type I error over time.
To control the overall error rate, the chance for a Type I error per point is often set to 0.0027 (corresponding to three standard deviations from the mean in a normal distribution).
Recognizing Process Problems
A point outside the control limits may indicate a process problem or a Type I error.
Management must investigate to determine the cause.
Control Charts for Variation
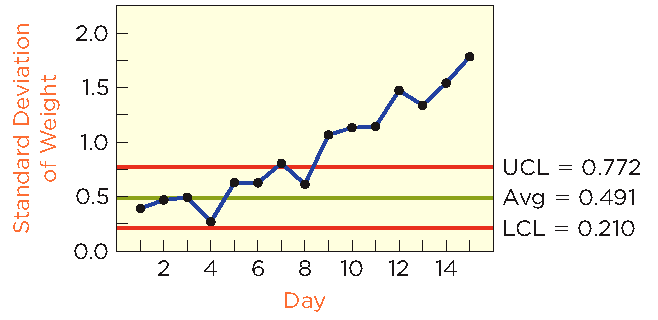
S-chart: Tracks the sample standard deviation over time.
R-chart: Tracks the sample range over time.
Both charts help monitor process variability, not just the mean.
Example: Monitoring a Call Center
Motivation and Method
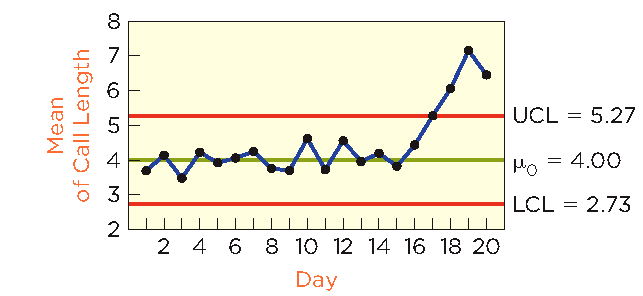
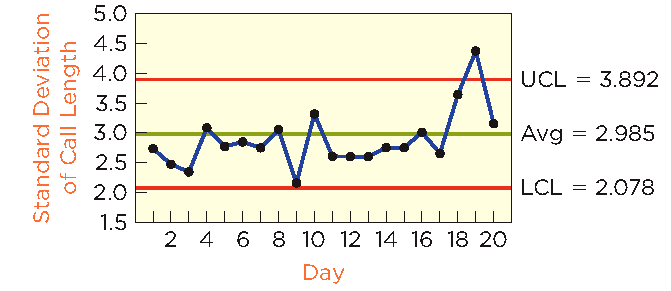
A bank monitors the length of calls to its Internet bill-paying service, sampling 50 calls per day.
Parameters: Mean call length min, standard deviation min.
Control limits are set three standard errors from the mean.
Results and Interpretation
Charts show that the average call length has increased and variability has risen, indicating a process change that management should investigate.
Best Practices and Pitfalls
Best Practices
Carefully select which process attribute to monitor (mean, variability, etc.).
Use both X-bar and S-charts for comprehensive monitoring.
Set control limits based on process parameters, not observed data.
Establish control limits before examining the data.
Be cautious when applying control limits to small samples.
Pitfalls to Avoid
Do not focus solely on one type of error (Type I or II) to the exclusion of the other.
Do not assume process failure solely based on a value outside control limits; investigate further.
Do not confuse the standard error of the mean with the sample standard deviation.
Do not use the number of samples (rather than sample size) when calculating the standard error.
