 Indietro
Functions of Several Variables and Their Domains: Partial Derivatives Chapter 14.1 Study Guide
Guida di studio - Note intelligenti
 Appunti personalizzati basati sui tuoi materiali, ampliati con definizioni chiave, esempi e contesto.
Functions of Several Variables
Definition and Evaluation
In multivariable calculus, a function of several variables assigns a unique real value to each ordered tuple of independent variables. For example, a function of two variables is written as , and a function of three variables as . The dependent variable (such as or ) depends on the values of the independent variables.
Independent variables: The input values (e.g., , , ).
Dependent variable: The output value (e.g., , ).
Domain: The set of all possible input values for which the function is defined.
Range: The set of all possible output values the function can produce.
Example: The volume of a cylinder depends on its radius and height : .
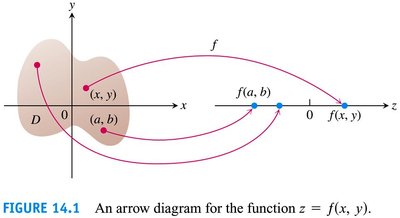
Domains and Ranges
Domain and Range Concepts
The domain of a function of several variables is typically a region in the plane (for two variables) or in space (for three variables). The range is the set of real values the function can take. Domains may be specified by inequalities or other restrictions to ensure the function produces real values.
Domain specification: For , the domain is .
Range specification: For , the range is .
Function | Domain | Range |
|---|---|---|
Entire plane | ||
Entire space | ||
Interior and Boundary Points
Definitions and Visualization
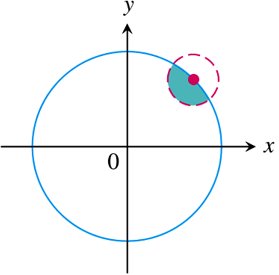
A point is an interior point of a region if a disk (for two variables) or ball (for three variables) centered at that point lies entirely within the region. A boundary point is one where every disk or ball centered at the point contains both points inside and outside the region.
Interior: All points with a neighborhood fully inside the region.
Boundary: Points where neighborhoods intersect both inside and outside.
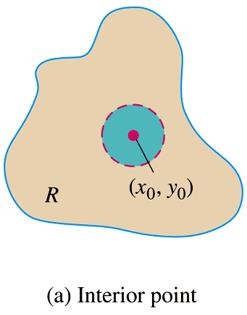
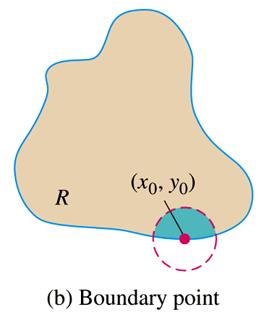
Open, Closed, and Bounded Sets
Classification of Domains
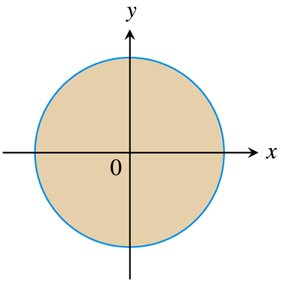
A set is open if it contains only interior points and no boundary points. It is closed if it contains all its boundary points. If it contains some but not all boundary points, it is neither open nor closed. A set is bounded if it lies within a disk (or ball) of finite radius.
Open set: No boundary points included.
Closed set: All boundary points included.
Bounded set: Fits inside a disk or ball of finite radius.
Example: The unit disk is open; is closed; is the boundary.
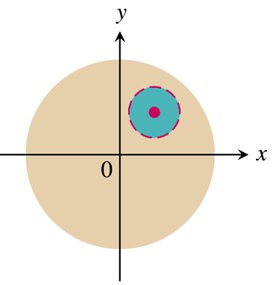
Domain Example: Parabolic Region
Describing Domains with Inequalities
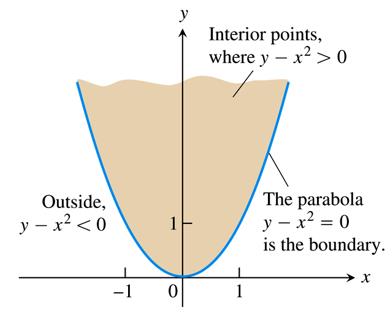
For , the domain consists of points where . The boundary is the parabola , and the interior consists of points above this curve.
Graphs, Level Curves, and Contours
Graphing Functions of Two Variables
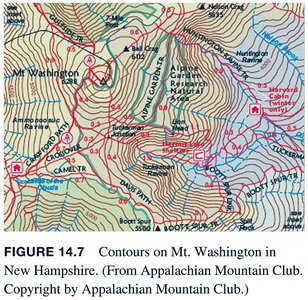
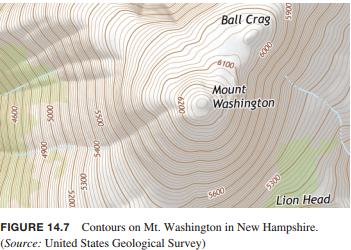
The graph of is the set of points where . This forms a surface in three-dimensional space. Level curves are sets of points where for a constant . These curves help visualize the function's behavior in the -plane.
Level curve: in the -plane.
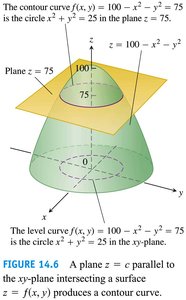
Contour curve: Intersection of the surface with the plane .
Topographical maps: Use level curves to represent altitude.
Example: Paraboloid and Level Curves
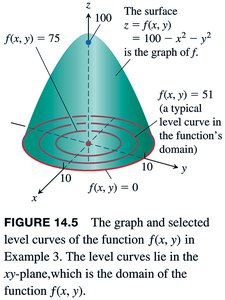
Graph and Level Curves of
The graph of is a paraboloid. Level curves for are circles in the -plane: , , .
Contour Curves
Distinction Between Level and Contour Curves
A contour curve is the intersection of the surface with the plane . The corresponding level curve is the projection onto the -plane. These concepts are often used interchangeably, but the distinction is important in advanced applications.
Functions of Three Variables
Level Surfaces
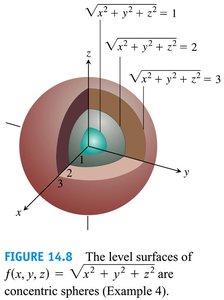
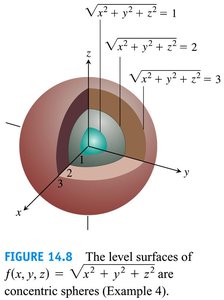
For , the graph lies in four-dimensional space and cannot be visualized directly. Level surfaces are sets where , forming surfaces in three-dimensional space. For example, has level surfaces that are spheres centered at the origin.
Computer Graphing
Visualization Tools
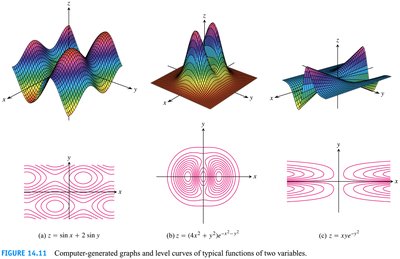
Three-dimensional graphing software can visualize functions of two variables and their level curves. These visualizations help identify regions of increase, decrease, and critical points.
Functions of More Than Three Variables
Higher-Dimensional Functions
Functions with more than three variables, such as , are important in applications like temperature distribution over time. Visualization relies on techniques from lower dimensions.
Example: Temperature at a point at time .
Summary of Key Concepts
Understand and evaluate functions of two or more variables.
Identify domain, range, independent, and dependent variables.
Classify points as interior or boundary, and domains as open, closed, bounded, or unbounded.
Graph functions of two variables and sketch level curves and surfaces.
