Ch. 1 - Functions
Briggs - Calculus: Early Transcendentals 3rd Edition
Briggs3rd EditionCalculus: Early TranscendentalsISBN: 9780136847243Non è quello che usi tu?Cambia libro di testo
Capitolo 1, Problema 21

Demand function Sales records indicate that if Blu-ray players are priced at \$250, then a large store sells an average of 12 units per day. If they are priced at \$200, then the store sells an average of 15 units per day. Find and graph the linear demand function for Blu-ray sales. For what prices is the demand function defined?

Guida verificata passo dopo passo
1
Step 1: Identify the given points that represent price and quantity pairs. The points are (250, 12) and (200, 15), where the first number in each pair is the price and the second is the quantity sold.
Step 2: Use the two points to find the slope of the demand function. The slope \( m \) is calculated using the formula \( m = \frac{y_2 - y_1}{x_2 - x_1} \), where \((x_1, y_1) = (250, 12)\) and \((x_2, y_2) = (200, 15)\).
Step 3: With the slope \( m \) found, use the point-slope form of a linear equation \( y - y_1 = m(x - x_1) \) to write the equation of the line. You can use either of the given points for \((x_1, y_1)\).
Step 4: Simplify the equation from the point-slope form to the slope-intercept form \( y = mx + b \), where \( b \) is the y-intercept. This gives you the linear demand function.
Step 5: Determine the domain of the demand function. The domain is the set of all possible prices for which the demand function is defined. Consider the context of the problem to decide reasonable price limits.

Risposta video verificata per un problema simile:

Questa soluzione video è stata consigliata dai nostri tutor come utile per risolvere questo problema.
Durata del video:
9m

Concetti chiave

Ecco i concetti essenziali che devi comprendere per rispondere correttamente alla domanda.

Linear Demand Function

A linear demand function represents the relationship between the price of a product and the quantity demanded, typically expressed in the form Q = mP + b, where Q is quantity, P is price, m is the slope, and b is the y-intercept. In this context, the slope indicates how much the quantity demanded changes with a change in price, allowing for predictions about sales at different price points.
Video consigliato:

Slope Calculation

The slope of a linear function is calculated as the change in quantity divided by the change in price (ΔQ/ΔP). In this case, using the two price points provided ($250 for 12 units and $200 for 15 units), the slope can be determined, which will help in formulating the demand function. A positive slope indicates that as the price decreases, the quantity demanded increases.
Video consigliato:
3:56
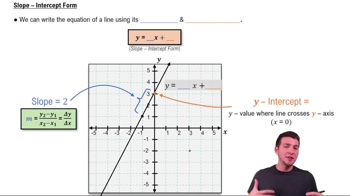
Slope-Intercept Form

Graphing the Demand Function

Graphing the demand function involves plotting the price on the vertical axis and the quantity demanded on the horizontal axis. The linear equation derived from the slope and intercept can be used to draw a straight line that represents the demand relationship. This visual representation helps in understanding how changes in price affect sales and can also indicate the range of prices over which the demand function is valid.
Video consigliato:
Percorso guidato
5:53
Graph of Sine and Cosine Function