Ch. 1 - Functions
Briggs - Calculus: Early Transcendentals 3rd Edition
Briggs3rd EditionCalculus: Early TranscendentalsISBN: 9780136847243Non è quello che usi tu?Cambia libro di testo
Capitolo 1, Problema 1.33

Graph the following functions.

This page contains the following errors:

error on line 1 at column 295: Unescaped '<' not allowed in attributes values

Below is a rendering of the page up to the first error.

Guida verificata passo dopo passo
1
Identify the function that needs to be graphed. If the function is not explicitly given, ensure that you have the correct expression or equation to work with.
Determine the domain of the function. This involves identifying all the possible input values (x-values) for which the function is defined.
Find the critical points of the function by taking its derivative and setting it equal to zero. Solve for x to find the points where the function's slope is zero, indicating potential maxima, minima, or points of inflection.
Evaluate the function at the critical points and endpoints of the domain to determine the corresponding y-values. This will help in understanding the behavior of the function at these key points.
Sketch the graph by plotting the critical points and any intercepts, and then draw the curve based on the behavior of the function as determined by its derivative and second derivative (if necessary). Consider asymptotic behavior and continuity to ensure an accurate representation.

Risposta video verificata per un problema simile:

Questa soluzione video è stata consigliata dai nostri tutor come utile per risolvere questo problema.
Durata del video:
6m

Concetti chiave

Ecco i concetti essenziali che devi comprendere per rispondere correttamente alla domanda.

Function Graphing

Graphing a function involves plotting points on a coordinate system that represent the relationship between the input (x-values) and output (y-values) of the function. Understanding how to interpret the function's equation and identify key features such as intercepts, slopes, and asymptotes is essential for accurate graphing.
Video consigliato:
Percorso guidato
5:53
Graph of Sine and Cosine Function

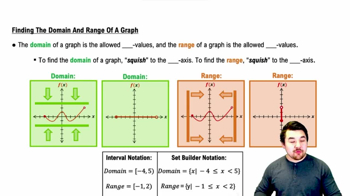
Domain and Range

The domain of a function is the set of all possible input values (x-values) that the function can accept, while the range is the set of all possible output values (y-values). Identifying the domain and range helps in understanding the behavior of the function and ensures that the graph accurately represents the function's limitations.
Video consigliato:
Percorso guidato
5:10
Finding the Domain and Range of a Graph

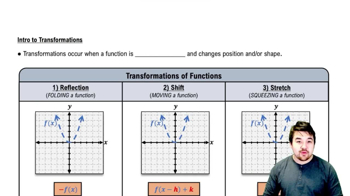
Transformations of Functions

Transformations involve shifting, stretching, compressing, or reflecting the graph of a function. Common transformations include vertical and horizontal shifts, which affect the position of the graph, and vertical stretches or compressions, which alter the steepness. Mastery of these concepts allows for the manipulation of basic function graphs to create more complex representations.
Video consigliato:
Percorso guidato
5:25
Intro to Transformations