Ch. 1 - Functions
Briggs - Calculus: Early Transcendentals 3rd Edition
Briggs3rd EditionCalculus: Early TranscendentalsISBN: 9780136847243Non è quello che usi tu?Cambia libro di testo
Capitolo 1, Problema 40a

The graph of ƒ is shown in the figure. Graph the following functions. <IMAGE>
a. ƒ(x+1)ƒ( x + 1)

Guida verificata passo dopo passo
1
Identify the transformation: The function \( f(x + 1) \) represents a horizontal shift of the graph of \( f(x) \).
Determine the direction of the shift: Since the transformation is \( f(x + 1) \), the graph of \( f(x) \) will shift to the left by 1 unit.
Sketch the new graph: Take each point on the original graph of \( f(x) \) and move it 1 unit to the left to obtain the graph of \( f(x + 1) \).
Check key points: Verify that key points on the graph, such as intercepts and turning points, have been shifted correctly.
Ensure continuity and shape: Make sure the overall shape and continuity of the graph are preserved after the transformation.

Risposta video verificata per un problema simile:

Questa soluzione video è stata consigliata dai nostri tutor come utile per risolvere questo problema.
Durata del video:
4m

Concetti chiave

Ecco i concetti essenziali che devi comprendere per rispondere correttamente alla domanda.

Function Transformation

Function transformation refers to the changes made to the graph of a function based on modifications to its equation. Common transformations include translations, reflections, stretches, and compressions. For instance, adding a constant to the input of a function, such as ƒ(x + 1), results in a horizontal shift of the graph to the left by one unit.
Video consigliato:
Percorso guidato
5:25
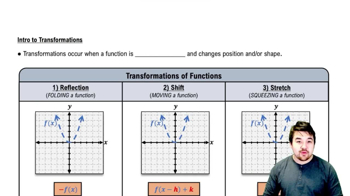
Intro to Transformations

Horizontal Shift

A horizontal shift occurs when the graph of a function is moved left or right along the x-axis. Specifically, for a function ƒ(x + c), where c is a positive constant, the graph shifts to the left by c units. Conversely, if c is negative, the graph shifts to the right. This concept is crucial for accurately graphing transformed functions.
Video consigliato:
Percorso guidato
5:25
Intro to Transformations

Graphing Functions

Graphing functions involves plotting points on a coordinate plane to visually represent the relationship between the input (x-values) and output (y-values) of a function. Understanding how to graph functions, including their transformations, is essential for interpreting their behavior and characteristics, such as intercepts, asymptotes, and overall shape.
Video consigliato:
Percorso guidato
5:53
Graph of Sine and Cosine Function