
Ch. 1 - Functions
Briggs - Calculus: Early Transcendentals 3rd Edition
Briggs3rd EditionCalculus: Early TranscendentalsISBN: 9780136847243Non è quello che usi tu?Cambia libro di testo
Capitolo 1, Problema 26

The population of a small town was 500 in 2018 and is growing at a rate of 24 people per year. Find and graph the linear population function p(t) that gives the population of the town t years after 2018. Then use this model to predict the population in 2033.

Guida verificata passo dopo passo
1
Identify the initial population and the rate of growth. The initial population in 2018 is 500, and the growth rate is 24 people per year.
Define the linear population function \( p(t) \) where \( t \) is the number of years after 2018. The function can be expressed as \( p(t) = 500 + 24t \).
To graph the function, plot the initial point (0, 500) on the graph, which represents the population in 2018.
Use the slope, which is 24, to determine another point on the graph. For example, after 1 year (\( t = 1 \)), the population will be \( p(1) = 500 + 24 \times 1 = 524 \). Plot the point (1, 524).
To predict the population in 2033, calculate \( t \) as the number of years from 2018 to 2033, which is 15 years. Substitute \( t = 15 \) into the function \( p(t) = 500 + 24t \) to find the population.

Risposta video verificata per un problema simile:

Questa soluzione video è stata consigliata dai nostri tutor come utile per risolvere questo problema.
Durata del video:
3m

Concetti chiave

Ecco i concetti essenziali che devi comprendere per rispondere correttamente alla domanda.

Linear Functions

A linear function is a mathematical expression that describes a straight line when graphed. It is typically represented in the form p(t) = mt + b, where m is the slope (rate of change) and b is the y-intercept (initial value). In this context, the population function will have a constant rate of growth, making it linear.
Video consigliato:

Slope and Intercept

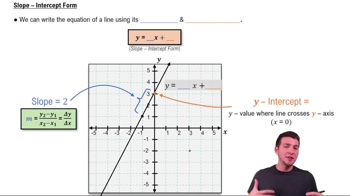
In the context of linear functions, the slope represents the rate of change of the function, while the intercept indicates the starting value. For the population function, the slope is the annual growth rate (24 people per year), and the intercept is the initial population (500 in 2018). Understanding these components is crucial for constructing the function.
Video consigliato:
3:56
Slope-Intercept Form

Graphing Linear Functions

Graphing a linear function involves plotting points that satisfy the function's equation and connecting them to form a straight line. For the population function, you would plot the population values against the years since 2018. This visual representation helps in understanding trends and making predictions, such as estimating the population in 2033.
Video consigliato: