

Ch. 2 - Limits
Briggs - Calculus: Early Transcendentals 3rd Edition
Briggs3rd EditionCalculus: Early TranscendentalsISBN: 9780136847243Non è quello che usi tu?Cambia libro di testo
Capitolo 2, Problema 2.5.51c

Complete the following steps for the given functions. 


c. Graph ff and all of its asymptotes with a graphing utility. Then sketch a graph of the function by hand, correcting any errors appearing in the computer-generated graph.


f(x)=x2−3x+6f\(\left\)(x\(\right\))=\(\frac{x^2-3}{x+6}\)

Guida verificata passo dopo passo
1
Step 1: Identify the vertical asymptote by setting the denominator equal to zero and solving for x. For the function \( f(x) = \frac{x^2 - 3}{x + 6} \), set \( x + 6 = 0 \) to find the vertical asymptote at \( x = -6 \).
Step 2: Determine the horizontal asymptote by comparing the degrees of the numerator and the denominator. Since the degree of the numerator (2) is greater than the degree of the denominator (1), there is no horizontal asymptote. Instead, there is an oblique (slant) asymptote.
Step 3: Find the oblique asymptote by performing polynomial long division of \( x^2 - 3 \) by \( x + 6 \). The quotient will give the equation of the oblique asymptote.
Step 4: Plot the function using a graphing utility to visualize the curve and its asymptotes. Pay attention to the behavior of the graph near the asymptotes.
Step 5: Sketch the graph by hand, ensuring to correct any discrepancies from the computer-generated graph, especially near the asymptotes and intercepts. Note the behavior of the function as it approaches the asymptotes.

Risposta video verificata per un problema simile:

Questa soluzione video è stata consigliata dai nostri tutor come utile per risolvere questo problema.
Durata del video:
14m

Concetti chiave

Ecco i concetti essenziali che devi comprendere per rispondere correttamente alla domanda.

Asymptotes

Asymptotes are lines that a graph approaches but never touches. They can be vertical, horizontal, or oblique. Vertical asymptotes occur where a function approaches infinity, typically at points where the denominator is zero. Horizontal asymptotes indicate the behavior of a function as x approaches infinity or negative infinity, showing the function's end behavior.
Video consigliato:
Percorso guidato
5:37
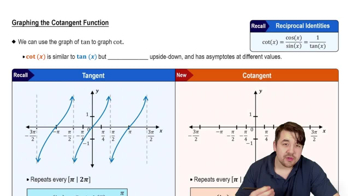
Introduction to Cotangent Graph

Graphing Rational Functions

Graphing rational functions involves plotting the function, which is a ratio of two polynomials. Key steps include identifying intercepts, asymptotes, and the overall shape of the graph. Understanding the behavior near asymptotes and the end behavior of the function is crucial for accurate representation. A graphing utility can assist in visualizing these features, but manual sketching helps correct any inaccuracies.
Video consigliato:
Percorso guidato
5:53
Graph of Sine and Cosine Function

End Behavior of Functions

The end behavior of a function describes how the function behaves as the input values approach positive or negative infinity. For rational functions, this behavior is influenced by the degrees of the numerator and denominator polynomials. Analyzing the leading coefficients and degrees helps predict whether the function will approach a finite value, infinity, or negative infinity, which is essential for sketching accurate graphs.
Video consigliato:
5:46
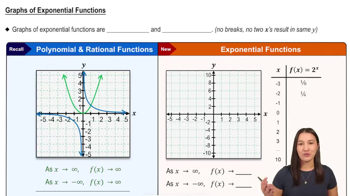
Graphs of Exponential Functions