Ch. 4 - Applications of the Derivative
Briggs - Calculus: Early Transcendentals 3rd Edition
Briggs3rd EditionCalculus: Early TranscendentalsISBN: 9780136847243Non è quello che usi tu?Cambia libro di testo
Capitolo 4, Problema 107a

Interpreting the derivative The graph of f' on the interval [-3,2] is shown in the figure. <IMAGE>


a. On what interval(s) is f increasing? Decreasing?

Guida verificata passo dopo passo
1
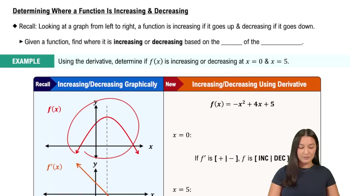
To determine where the function f is increasing or decreasing, we need to analyze the sign of its derivative f'. A function f is increasing on intervals where f' is positive and decreasing where f' is negative.
Examine the graph of f' over the interval [-3, 2]. Identify the sections where the graph of f' is above the x-axis (positive) and where it is below the x-axis (negative).
List the intervals where f' is positive. These intervals correspond to where the function f is increasing.
List the intervals where f' is negative. These intervals correspond to where the function f is decreasing.
Ensure to consider any points where f' crosses the x-axis, as these are points where the behavior of f changes from increasing to decreasing or vice versa.

Risposta video verificata per un problema simile:

Questa soluzione video è stata consigliata dai nostri tutor come utile per risolvere questo problema.
Durata del video:
3m

Concetti chiave

Ecco i concetti essenziali che devi comprendere per rispondere correttamente alla domanda.

Derivative and Its Interpretation

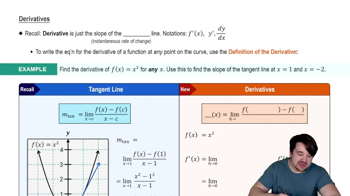
The derivative of a function, denoted as f', represents the rate of change of the function f with respect to its variable. It provides critical information about the function's behavior, specifically whether it is increasing or decreasing. When f' is positive, the function f is increasing; when f' is negative, f is decreasing.
Video consigliato:

Critical Points

Critical points occur where the derivative f' is zero or undefined. These points are essential for determining intervals of increase and decrease, as they can indicate potential local maxima or minima. Analyzing the sign of the derivative around these points helps in understanding the overall behavior of the function.
Video consigliato:
04:50
Critical Points

Sign Chart

A sign chart is a visual tool used to determine the intervals where a function is increasing or decreasing based on the sign of its derivative. By plotting the critical points and testing intervals between them, one can easily see where the derivative is positive (indicating increase) or negative (indicating decrease), thus providing a clear picture of the function's behavior over the specified interval.
Video consigliato:
07:32
Determining Where a Function is Increasing & Decreasing