Consider the lim_x→∞ (√ ax + b) / √cx + d where a, b, c, and d are positive real numbers. Show that l’Hôpital’s Rule fails for this limit. Find the limit using another method.
Ch. 4 - Applications of the Derivative
Briggs3rd EditionCalculus: Early TranscendentalsISBN: 9780136847243Non è quello che usi tu?Cambia libro di testo
Capitolo 4, Problema 106
{Use of Tech} Graph carefully Graph the function f(x) = 60x⁵ - 901x³ + 27x in the window [-4,4] x [-10,000, 10,000]. How many extreme values do you see? Locate all the extreme values by analyzing f'.
Guida verificata passo dopo passo1
First, find the derivative of the function f(x) = 60x⁵ - 901x³ + 27x. This will help us identify the critical points where extreme values might occur. The derivative, f'(x), is calculated using the power rule.
Apply the power rule to each term: for 60x⁵, the derivative is 300x⁴; for -901x³, the derivative is -2703x²; and for 27x, the derivative is 27. Thus, f'(x) = 300x⁴ - 2703x² + 27.
Set the derivative f'(x) equal to zero to find the critical points: 300x⁴ - 2703x² + 27 = 0. Solve this equation for x to find the potential extreme values.
Analyze the critical points found in the previous step by using the second derivative test or by evaluating the sign changes of f'(x) around these points to determine if they correspond to local maxima, minima, or saddle points.
Finally, graph the function f(x) = 60x⁵ - 901x³ + 27x in the specified window [-4,4] x [-10,000, 10,000] to visually confirm the number and location of extreme values. Compare these with the critical points found analytically.

Risposta video verificata per un problema simile:
Questa soluzione video è stata consigliata dai nostri tutor come utile per risolvere questo problema.
Durata del video:
7mConcetti chiave
Ecco i concetti essenziali che devi comprendere per rispondere correttamente alla domanda.
Graphing Polynomial Functions
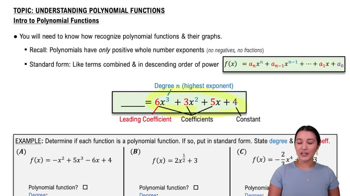
Graphing polynomial functions involves plotting the curve of a polynomial equation, which in this case is f(x) = 60x⁵ - 901x³ + 27x. Understanding the behavior of polynomials, such as end behavior and turning points, is crucial. The degree and leading coefficient of the polynomial help predict the graph's shape and direction.
Video consigliato:
Introduction to Polynomial Functions
Derivative and Critical Points
The derivative of a function, denoted as f', provides information about the function's rate of change. Critical points occur where the derivative is zero or undefined, indicating potential extreme values (maxima or minima). Analyzing f' helps locate these points, which are essential for understanding the function's behavior and identifying extreme values.
Video consigliato:
Critical Points
Extreme Values and Their Identification
Extreme values of a function are the highest or lowest points on its graph, known as maxima and minima. These can be local (within a specific interval) or global (overall). By analyzing the critical points found from the derivative, one can determine where these extreme values occur, which is crucial for understanding the function's overall behavior.
Video consigliato:
Percorso guidato
Average Value of a Function
Pratica correlata
Domanda del libro di testo
239
views
Domanda del libro di testo
More limits Evaluate the following limits.
lim_x→1 (x ln x - x + 1) / (xln²x)
278
views
Domanda del libro di testo
Interpreting the derivative The graph of f' on the interval [-3,2] is shown in the figure. <IMAGE>
a. On what interval(s) is f increasing? Decreasing?
206
views
Domanda del libro di testo
The graph of f' on the interval [-3,2] is shown in the figure. <IMAGE>
c. At what point(s) does f have an inflection point?
246
views
Domanda del libro di testo
Use limit methods to determine which of the two given functions grows faster, or state that they have comparable growth rates.
x² ln x; x³
254
views
Domanda del libro di testo
Use limit methods to determine which of the two given functions grows faster, or state that they have comparable growth rates.
x²⁰ ; 1.0001ˣ
290
views