Ch. 9 - Differential Equations
Briggs - Calculus: Early Transcendentals 3rd Edition
Briggs3rd EditionCalculus: Early TranscendentalsISBN: 9780136847243Non è quello che usi tu?Cambia libro di testo
Capitolo 9, Problema 9.5.11

9–14. Growth rate functions Make a sketch of the population function P (as a function of time) that results from the following growth rate functions. Assume the population at time t = 0 begins at some positive value.


<IMAGE>

Guida verificata passo dopo passo
1
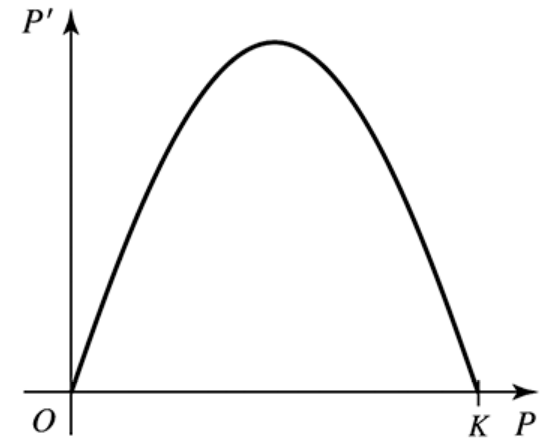
Step 1: Understand the graph provided. The graph shows the growth rate function \(P'(t)\) plotted against the population \(P\). The curve starts at \(P=0\) with \(P'=0\), rises to a maximum positive growth rate at some intermediate population, and then decreases back to \(P'=0\) at \(P=K\).
Step 2: Interpret the meaning of \(P'\) in terms of population growth. Since \(P'(t)\) represents the rate of change of the population \(P\) with respect to time \(t\), positive values of \(P'\) mean the population is increasing, and negative values would mean the population is decreasing. Here, \(P'\) is zero at \(P=0\) and \(P=K\), and positive in between.
Step 3: Sketch the population function \(P(t)\) starting from a positive initial population \(P(0)\). Since \(P'(t)\) is positive for \(0 < P < K\), the population will increase over time until it approaches \(K\). At \(P=K\), the growth rate \(P'\) is zero, so the population stabilizes and stops growing.
Step 4: Consider the shape of \(P(t)\). Because \(P'(t)\) increases then decreases as \(P\) approaches \(K\), the population growth rate accelerates initially, then slows down as it nears the carrying capacity \(K\). This suggests an S-shaped or logistic growth curve for \(P(t)\).
Step 5: Conclude that the population \(P(t)\) will start at a positive value, increase over time with a decreasing growth rate as it approaches \(K\), and eventually level off at \(P=K\), representing a stable equilibrium population.

Risposta video verificata per un problema simile:

Questa soluzione video è stata consigliata dai nostri tutor come utile per risolvere questo problema.
Durata del video:
2m

Concetti chiave

Ecco i concetti essenziali che devi comprendere per rispondere correttamente alla domanda.

Relationship Between a Function and Its Derivative

The derivative of a function represents its rate of change. In this problem, P' is the growth rate of the population P. Understanding how the sign and magnitude of P' affect the shape of P is crucial: where P' is positive, P increases; where P' is zero, P has critical points; and where P' is negative, P decreases.
Video consigliato:
06:30
Derivatives of Other Trig Functions

Interpreting the Graph of the Growth Rate Function

The graph shows P' as a function of P, starting at zero at P=0, rising to a maximum, then returning to zero at P=K. This indicates that the growth rate increases with population up to a point, then decreases to zero at a carrying capacity K, suggesting logistic growth behavior.
Video consigliato:
Percorso guidato
5:53
Graph of Sine and Cosine Function

Sketching Population Functions from Growth Rates

To sketch P(t) from P'(P), consider how the growth rate changes with population size. Starting from a positive initial population, P will increase when P' > 0, slow down as P' approaches zero, and stabilize at P=K where growth rate is zero. This results in an S-shaped logistic curve for P(t).
Video consigliato:
Percorso guidato
06:16
Real World Application