

Ch. 1 - Functions
Hass - Thomas' Calculus 15th Edition
Hass15th EditionThomas' CalculusISBN: 9780137616077Non è quello che usi tu?Cambia libro di testo
Capitolo 1, Problema 47

Graph ƒ₁ and ƒ₂ together. Then describe how applying the absolute value function in ƒ₂ affects the graph of ƒ₁.


ƒ₁(x)        ƒ₂(x)
 x³          |x³|

Guida verificata passo dopo passo
1
Start by graphing the function \( f_1(x) = x^3 \). This is a cubic function, which is an odd function, meaning it is symmetric about the origin. The graph passes through the origin (0,0) and has the general shape of an 'S' curve, increasing from left to right.
Next, graph the function \( f_2(x) = |x^3| \). The absolute value function affects the graph by reflecting any negative values of \( f_1(x) \) above the x-axis. This means that for \( x < 0 \), the graph of \( f_2(x) \) will be the mirror image of \( f_1(x) \) above the x-axis.
Observe that for \( x > 0 \), the graph of \( f_2(x) \) is identical to \( f_1(x) \) because the values of \( x^3 \) are already positive, so the absolute value does not change them.
For \( x = 0 \), both \( f_1(x) \) and \( f_2(x) \) are equal to 0, so the point (0,0) remains unchanged.
In summary, the effect of applying the absolute value to \( f_1(x) \) to get \( f_2(x) \) is to reflect the portion of the graph of \( f_1(x) \) that is below the x-axis to above the x-axis, resulting in a graph that is entirely non-negative.

Risposta video verificata per un problema simile:

Questa soluzione video è stata consigliata dai nostri tutor come utile per risolvere questo problema.
Durata del video:
5m

Concetti chiave

Ecco i concetti essenziali che devi comprendere per rispondere correttamente alla domanda.

Graphing Functions

Graphing functions involves plotting points on a coordinate plane to visualize the relationship between the input (x-values) and output (y-values) of a function. For the functions ƒ₁(x) = x³ and ƒ₂(x) = |x³|, understanding how to graph polynomial and absolute value functions is essential. The graph of ƒ₁ will show a cubic curve, while ƒ₂ will reflect any negative values of ƒ₁ above the x-axis.
Video consigliato:
Percorso guidato
5:53
Graph of Sine and Cosine Function

Absolute Value Function

The absolute value function, denoted as |x|, transforms any negative input into a positive output while leaving positive inputs unchanged. In the context of ƒ₂(x) = |x³|, this means that all negative values of x³ will be reflected above the x-axis, resulting in a graph that is symmetric with respect to the y-axis for the negative x-values. This transformation alters the shape of the graph significantly.
Video consigliato:
Percorso guidato
06:37
Average Value of a Function

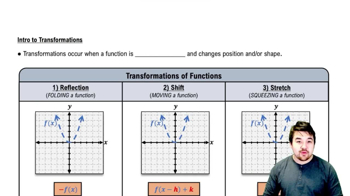
Effect of Transformations on Graphs

Transformations in calculus refer to changes made to the graph of a function, such as reflections, translations, or stretches. Applying the absolute value function to ƒ₁(x) = x³ results in a reflection of the portions of the graph that lie below the x-axis, effectively changing the overall shape of the graph. This concept is crucial for understanding how different functions can be manipulated and how their graphs can be interpreted.
Video consigliato:
Percorso guidato
5:25
Intro to Transformations