


Ch. 1 - Functions
Hass - Thomas' Calculus 15th Edition
Hass15th EditionThomas' CalculusISBN: 9780137616077Non è quello che usi tu?Cambia libro di testo
Capitolo 1, Problema 53f

Shifting and Scaling Graphs


Suppose the graph of g is given. Write equations for the graphs that are obtained from the graph of g by shifting, scaling, or reflecting, as indicated.


f. Compress horizontally by a factor of 5

Guida verificata passo dopo passo
1
Start with the function g(x), which represents the original graph.
To compress the graph horizontally by a factor of 5, you need to modify the input variable x in the function g(x).
The horizontal compression by a factor of 5 means that every x-value is divided by 5. This is achieved by replacing x with 5x in the function.
Thus, the new function that represents the horizontally compressed graph is g(5x).
This transformation will make the graph appear narrower, as each point on the graph is now closer to the y-axis.

Risposta video verificata per un problema simile:

Questa soluzione video è stata consigliata dai nostri tutor come utile per risolvere questo problema.
Durata del video:
1m

Concetti chiave

Ecco i concetti essenziali che devi comprendere per rispondere correttamente alla domanda.

Horizontal Compression

Horizontal compression refers to the transformation of a graph where the x-coordinates of points on the graph are multiplied by a factor less than 1. In this case, compressing horizontally by a factor of 5 means that for every point (x, g(x)) on the graph of g, the new point will be (x/5, g(x)). This transformation effectively 'squeezes' the graph towards the y-axis.
Video consigliato:
04:50
Critical Points

Function Transformation

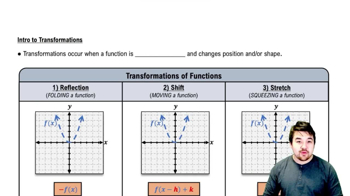
Function transformations involve changing the position or shape of a graph through various operations such as shifting, scaling, or reflecting. Each transformation can be represented mathematically, allowing us to derive new functions from existing ones. Understanding these transformations is crucial for predicting how the graph will behave after modifications.
Video consigliato:
Percorso guidato
5:25
Intro to Transformations

Graph of a Function

The graph of a function is a visual representation of the relationship between the input (x-values) and output (y-values) of the function. It provides insight into the function's behavior, including its intercepts, slopes, and overall shape. Analyzing the graph helps in understanding how transformations like shifting and scaling affect the function's characteristics.
Video consigliato:
Percorso guidato
5:53
Graph of Sine and Cosine Function