

Ch. 1 - Functions
Hass - Thomas' Calculus 15th Edition
Hass15th EditionThomas' CalculusISBN: 9780137616077Non è quello che usi tu?Cambia libro di testo
Capitolo 1, Problema 54a

Describe how each graph is obtained from the graph of 𝔂 = ƒ(x).


a. 𝔂 = ƒ(x - 5)

Guida verificata passo dopo passo
1
Start with the graph of the function 𝔂 = ƒ(x). This is your base graph.
Identify the transformation applied to the function. In this case, the transformation is 𝔂 = ƒ(x - 5).
Recognize that the expression (x - 5) inside the function indicates a horizontal shift. Specifically, it is a shift to the right.
To apply this transformation, take each point (x, y) on the original graph of 𝔂 = ƒ(x) and move it 5 units to the right. This means you will replace each x-coordinate with (x + 5).
Plot the new points to obtain the graph of 𝔂 = ƒ(x - 5). The shape of the graph remains unchanged, but its position is shifted 5 units to the right.

Risposta video verificata per un problema simile:

Questa soluzione video è stata consigliata dai nostri tutor come utile per risolvere questo problema.
Durata del video:
3m

Concetti chiave

Ecco i concetti essenziali che devi comprendere per rispondere correttamente alla domanda.

Function Transformation

Function transformation refers to the process of altering the graph of a function through shifts, stretches, or reflections. These transformations can change the position and shape of the graph without altering its fundamental properties. Understanding how to manipulate the function's equation allows one to predict how the graph will change.
Video consigliato:
Percorso guidato
5:25
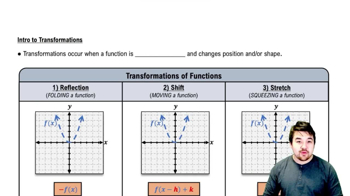
Intro to Transformations

Horizontal Shifts

A horizontal shift occurs when the graph of a function is moved left or right along the x-axis. For the function 𝔶 = ƒ(x - 5), the graph is shifted 5 units to the right. This transformation is achieved by replacing x with (x - c), where c is the number of units shifted, affecting the input values of the function.
Video consigliato:
Percorso guidato
5:25
Intro to Transformations

Graphing Functions

Graphing functions involves plotting points that represent the output of a function for various input values. Understanding how to graph functions is essential for visualizing transformations. By knowing the original graph of 𝔶 = ƒ(x), one can easily apply transformations to see how the graph changes, enhancing comprehension of function behavior.
Video consigliato:
Percorso guidato
5:53
Graph of Sine and Cosine Function