Ch. 2 - Limits and Continuity
Hass - Thomas' Calculus 15th Edition
Hass15th EditionThomas' CalculusISBN: 9780137616077Non è quello che usi tu?Cambia libro di testo
Capitolo 2, Problema 1a

Finding Limits Graphically


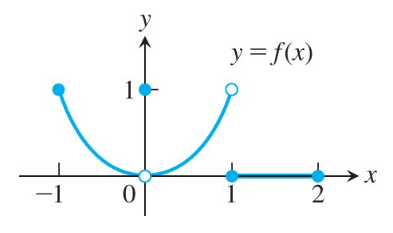
Which of the following statements about the function y = f(x) graphed here are true, and which are false?


img


a. limx→−1+ f(x) = 1

Guida verificata passo dopo passo
1
Examine the graph of the function y = f(x) as x approaches -1 from the right (x → -1+). This means you should look at the values of f(x) as x gets closer to -1 from values greater than -1.
Identify the y-value that the function approaches as x approaches -1 from the right. This is the value of the right-hand limit, limx→−1+ f(x).
Check if the y-value that the function approaches as x approaches -1 from the right is equal to 1.
If the y-value is equal to 1, then the statement limx→−1+ f(x) = 1 is true. Otherwise, it is false.
Conclude whether the statement is true or false based on the y-value identified in the previous steps.

Risposta video verificata per un problema simile:

Questa soluzione video è stata consigliata dai nostri tutor come utile per risolvere questo problema.
Durata del video:
3m

Concetti chiave

Ecco i concetti essenziali che devi comprendere per rispondere correttamente alla domanda.

Limits

A limit is a fundamental concept in calculus that describes the behavior of a function as its input approaches a certain value. It helps in understanding how functions behave near points of interest, including points of discontinuity. For example, limx→−1+ f(x) refers to the limit of f(x) as x approaches -1 from the right side.
Video consigliato:
05:50
One-Sided Limits

One-Sided Limits

One-sided limits are limits that consider the behavior of a function as the input approaches a specific value from one direction only. The notation limx→−1+ f(x) indicates the limit as x approaches -1 from the right (values greater than -1). This is crucial for analyzing functions that may behave differently from the left and right at a point.
Video consigliato:
05:50
One-Sided Limits

Graphical Interpretation of Limits

Graphical interpretation of limits involves analyzing the graph of a function to determine the value that the function approaches as the input approaches a certain point. By observing the graph near x = -1, one can visually assess whether the function approaches a specific value, which aids in confirming or refuting statements about limits.
Video consigliato:
6:47
Finding Limits Numerically and Graphically