
Ch. 3 - Derivatives
Hass - Thomas' Calculus 15th Edition
Hass15th EditionThomas' CalculusISBN: 9780137616077Non è quello che usi tu?Cambia libro di testo
Capitolo 3, Problema 3.4.33d

Analyzing Motion Using Graphs


[Technology Exercise] Exercises 31–34 give the position function s = f(t) of an object moving along the s-axis as a function of time t. Graph f together with the velocity function v(t) = ds/dt = f'(t) and the acceleration function a(t) = d²s/dt² = f''(t). Comment on the object’s behavior in relation to the signs and values of v and a. Include in your commentary such topics as the following:


d. When does it speed up and slow down?


s = t³ - 6t² + 7t, 0 ≤ t ≤ 4

Guida verificata passo dopo passo
1
Step 1: Identify the position function s(t) = t³ - 6t² + 7t. This function describes the position of the object along the s-axis as a function of time t.
Step 2: Find the velocity function v(t) by differentiating the position function s(t) with respect to time t. This gives v(t) = ds/dt = f'(t) = 3t² - 12t + 7.
Step 3: Find the acceleration function a(t) by differentiating the velocity function v(t) with respect to time t. This gives a(t) = dv/dt = f''(t) = 6t - 12.
Step 4: Analyze the signs of v(t) and a(t) to determine when the object speeds up or slows down. The object speeds up when v(t) and a(t) have the same sign and slows down when they have opposite signs.
Step 5: Graph the functions s(t), v(t), and a(t) over the interval 0 ≤ t ≤ 4. Use the graphs to visually confirm the intervals where the object speeds up or slows down based on the behavior of v(t) and a(t).

Risposta video verificata per un problema simile:

Questa soluzione video è stata consigliata dai nostri tutor come utile per risolvere questo problema.
Durata del video:
4m

Concetti chiave

Ecco i concetti essenziali che devi comprendere per rispondere correttamente alla domanda.

Position, Velocity, and Acceleration

In calculus, the position function s(t) describes the location of an object over time. The velocity function v(t) is the first derivative of the position function, representing the rate of change of position, or speed, with direction. Acceleration a(t) is the second derivative of the position function, indicating the rate of change of velocity. Understanding these relationships is crucial for analyzing motion.
Video consigliato:
Percorso guidato
08:14
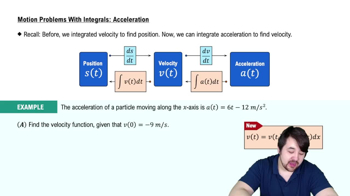
Using The Acceleration Function

Graphical Analysis of Derivatives

Graphing the position, velocity, and acceleration functions helps visualize how an object's motion changes over time. The slope of the position graph at any point gives the velocity, while the slope of the velocity graph gives the acceleration. Observing these graphs allows us to determine when the object is speeding up or slowing down based on the signs and magnitudes of v(t) and a(t).
Video consigliato:
01:47
Graphical Applications of Exponential & Logarithmic Derivatives: Example 8

Interpreting Signs of Velocity and Acceleration

The signs of velocity and acceleration are key to understanding an object's motion. When both velocity and acceleration have the same sign, the object speeds up. Conversely, when they have opposite signs, the object slows down. Analyzing these signs in the context of the given functions helps predict and explain the object's behavior over time.
Video consigliato:
Percorso guidato
06:15
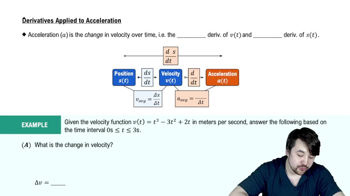
Derivatives Applied To Acceleration
Pratica correlata
Domanda del libro di testo

Differentiability and Continuity on an Interval


Each figure in Exercises 45–50 shows the graph of a function over a closed interval D. At what domain points does the function appear to be


c. neither continuous nor differentiable?


Give reasons for your answers.


193
views
Domanda del libro di testo

Theory and Examples


In Exercises 51–54,


d. Over what intervals of x-values, if any, does the function y = f(x) increase as x increases? Decrease as x increases? How is this related to what you found in part (c)? (We will say more about this relationship in Section 4.3.)


y = −1/x

180
views
Domanda del libro di testo

Right circular cylinder The total surface area S of a right circular cylinder is related to the base radius r and height h by the equation S = 2πr² + 2πrh.


d. How is dr/dt related to dh/dt if S is constant?

246
views
Domanda del libro di testo

By computing the first few derivatives and looking for a pattern, find the following derivatives.


c. d⁷³/dx⁷³ (x sin x)

193
views
Domanda del libro di testo

Theory and Examples


In Exercises 51–54,


d. Over what intervals of x-values, if any, does the function y = f(x) increase as x increases? Decrease as x increases? How is this related to what you found in part (c)? (We will say more about this relationship in Section 4.3.)


y = x³/3

218
views
Domanda del libro di testo

Particle motion At time t, the position of a body moving along the s-axis is s = t³ − 6t² + 9t m.


c. Find the total distance traveled by the body from t = 0 to t = 2.

243
views